MODE IN STATISTICS
Mode is one of the measures of central tendency which can be defined as follows.
For a given set of observations, mode may be defined as the value that occurs the maximum number of times.
Thus, mode is that value which has the maximum concentration of the observations around it. This can also be described as the most common value with which, even, a layman may be familiar with.
Thus, if the observations are 5, 3, 8, 9, 5 and 6, then Mode (Mo) = 5 as it occurs twice and all the other observations occur just once.
The definition for mode also leaves scope for more than one mode. Thus sometimes we may come across a distribution having more than one mode. Such a distribution is known as a multi-modal distribution. Bi-modal distribution is one having two modes.
Furthermore, it also appears from the definition that mode is not always defined. As an example,
If the marks of 5 students are 50, 60, 35, 40, 56, there is no modal mark as all the observations occur once i.e. the same number of times.
We may consider the following formula for computing mode from a grouped frequency distribution:

where,
l1 = LCB of the modal class
f0 = frequency of the modal class
f-1 = frequency of the pre modal class
f1 = frequency of the post modal class
C = class length of the modal class
Practice Problem
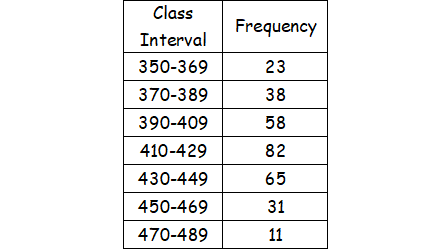
Compute the mode for the following distribution

Solution :
Computation of mode :

For the given data, the formula to find mode is given by

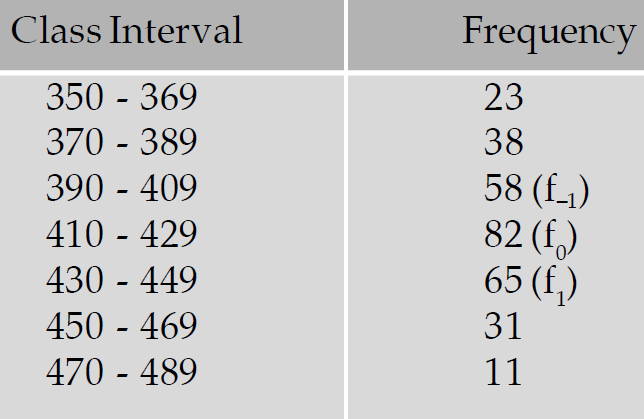
Going through the frequency column, we note that the highest frequency i.e. f0 is 82.
Then, f-1 = 58 and f1 = 65.
Also, the modal class i.e. the class against the highest frequency is (410 - 419).
Thus,
l1 = LCB = 409.50
C = 429.50 - 409.50 = 20
C = 429.50 – 409.50 = 20
Substitute these values in the above formula.
Mode = 409.50 + [(82 - 58)/(2 ⋅ 52 - 58 - 65)] ⋅ 20
= 409.50 + 11.71
= 421.21
Relation between Mean Median and Mode
When it is difficult to compute mode from a grouped frequency distribution, we may consider the following empirical relationship between mean, median and mode :
Mean - Mode = 3(Mean - Median)
or
Mode = 3median - 2mean
The above result holds for holds for a moderately skewed distribution.
Note :
If y = a + bx, then we have
mode of y = a + b(mode of x)
For example, if y = 2 + 1.50x and mode of x is 15, then
mode of y = 2 + 1.50(mode of x)
= 2 + 1.50 ⋅ 15
= 2 + 22.50
= 24.50
Properties of Mode
1. Although mode is the most popular measure of central tendency, there are cases when mode remains undefined.
2. Unlike mean, it has no mathematical property.
3. Mode is affected by sampling fluctuations.

Apart from the stuff given above, if you need any other stuff in math, please use our google custom search here.
Kindly mail your feedback to v4formath@gmail.com
We always appreciate your feedback.
©All rights reserved. onlinemath4all.com
Recent Articles
-
SAT Math Resources (Videos, Concepts, Worksheets and More)
Nov 15, 24 01:21 AM
SAT Math Resources (Videos, Concepts, Worksheets and More) -
Digital SAT Math Problems and Solutions (Part - 69)
Nov 15, 24 01:21 AM
Digital SAT Math Problems and Solutions (Part - 69) -
Times Table Shortcuts
Nov 14, 24 07:18 PM
Times Table Shortcuts - Concept - Examples
