COEFFICIENT OF CONCURRENT DEVIATIONS
A very simple and casual method of finding correlation when we are not serious about the magnitude of the two variables is the application of concurrent deviations.
This method involves in attaching a positive sign for a x-value (except the first) if this value is more than the previous value and assigning a negative value if this value is less than the previous value.
This is done for the y-series as well. The deviation in the x-value and the corresponding y-value is known to be concurrent if both the deviations have the same sign.
Denoting the number of concurrent deviation by c and total number of deviations as m (which must be one less than the number of pairs of x and y values), the coefficient of concurrent-deviations is given by

If (2c–m) > 0, then we take the positive sign both inside and outside the radical sign and if (2c–m) < 0, we are to consider the negative sign both inside and outside the radical sign.
Like Pearson’s correlation coefficient and Spearman’s rank correlation coefficient, the coefficient of concurrent- deviations also lies between –1 and 1, both inclusive.
That is,
-1 ≤ r ≤ 1
Problem :
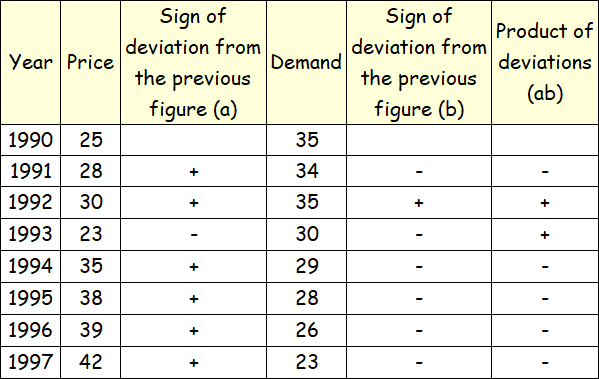
Find the coefficient of concurrent deviations from the following data.

Solution :
Computation of Coefficient of Concurrent-Deviations.

In this case,
m = number of pairs of deviations
m = 7
c = no. of positive signs in the product of deviations column
c = no. of concurrent deviations
c = 2
Thus,
rC = ±√±[(2c - m)/m]
Substitute.
= ±√±[(4 - 7)/7]
= ±√±[(-3)/7]
= -√(3/7)
≈ -0.65
Product of Deviations - Special Case
We attach a positive sign for a x-value (except the first) if this value is more than the previous value and assigning a negative value if this value is less than the previous value.
In case, a particular value is equal to the previous value, we have to attach = sign to that value.
And we have to do product of deviations as given below.
x
=
=
+
-
y
+
-
=
=
Product of deviations
-
-
-
-
Since (= and +) or (= and -) are different signs, we have to put negative sign in the column 'product of deviations'.
Note :
There are some cases when we may find a correlation between two variables although the two variables are not causally related.
This is due to the existence of a third variable which is related to both the variables under consideration.
Such a correlation is known as spurious correlation or non-sense correlation.
As an example, there could be a positive correlation between production of rice and that of iron in India for the last twenty years due to the effect of a third variable time on both these variables.
It is necessary to eliminate the influence of the third variable before computing correlation between the two original variables.
Kindly mail your feedback to v4formath@gmail.com
We always appreciate your feedback.
©All rights reserved. onlinemath4all.com
Recent Articles
-
SAT Math Resources (Videos, Concepts, Worksheets and More)
Nov 19, 24 09:14 AM
SAT Math Resources (Videos, Concepts, Worksheets and More) -
Digital SAT Math Problems and Solutions (Part - 73)
Nov 19, 24 09:13 AM
Digital SAT Math Problems and Solutions (Part - 73) -
Digital SAT Math Problems and Solutions (Part - 72)
Nov 18, 24 08:15 AM
Digital SAT Math Problems and Solutions (Part - 72)

