USING INEQUALITIES TO DESCRIBE QUANTITIES
Subscribe to our ▶️ YouTube channel 🔴 for the latest videos, updates, and tips.
An inequality is a statement that two quantities are not equal.
The following symbols of inequalities can be used to describe quantities.
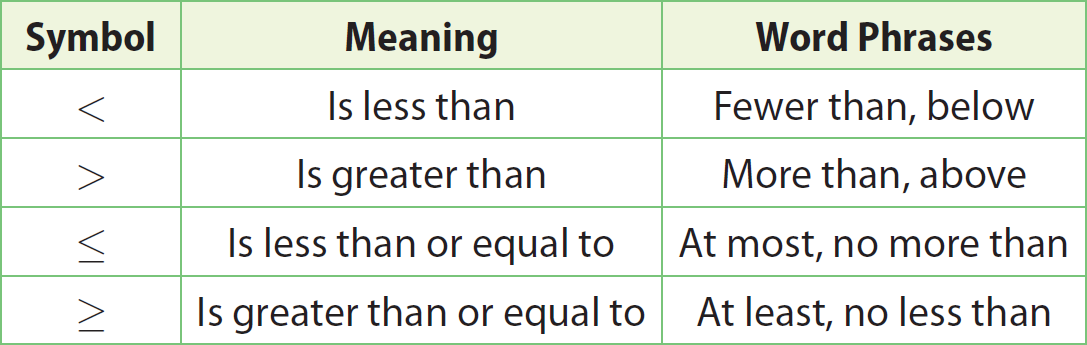
We can use a number line to help write an inequality.
That is, if we want to write an inequality with two numbers, first we have to locate the numbers on the number line and mark them.
The number which comes to the right of the other number is greater. The number which comes to the left of the other number is smaller.
Solved Examples
Example 1 :
Describe the two quantities -4 and 4 using inequality.
Solution :
Let us locate the two integers -4 and 4 on a number line and mark them.
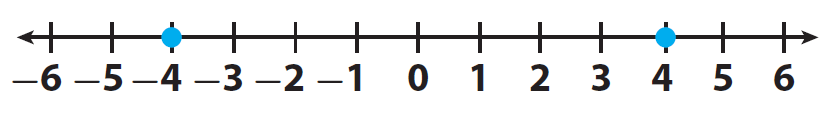
Here, the positive integer 4 comes to the right of -4.
Therefore "4" is greater than "-4"
It can be written as 4 > -4.
And -4 comes to the left of 4.
Therefore "-4" is smaller than "4"
It can be written as -4 < 4
Example 2 :
Describe the two quantities -1 and 1 using inequality.
Solution :
Let us locate the two integers -1 and 1 on a number line and mark them.
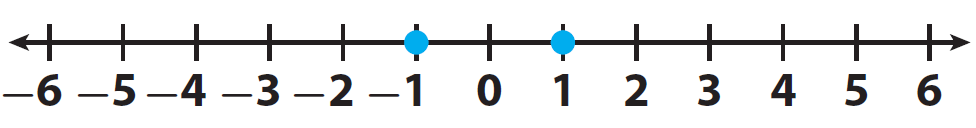
Here, the positive integer 1 comes to the right of -1.
Therefore "1" is greater than "-1"
It can be written as 1 > -1.
And -1 comes to the left of 1.
Therefore "-1" is smaller than "1"
It can be written as -1 > 1.
Example 3 :
Question (i) :
The lowest temperature ever recorded in Florida was -2 °F. Graph this temperature on the number line.
Solution :

Question (ii) :
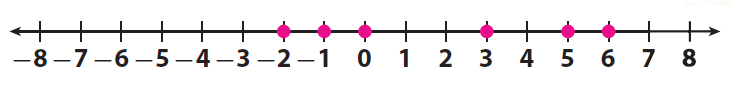
The temperatures 0 °F, 3 °F, 6 °F, 5 °F, and -1 °F have also been recorded in Florida. Graph these temperatures on the number line.
Solution :
Question (iii) :
How do the temperatures in question (ii) compare with -2? How can we see this relationship on the number line ?
Solution :
They are all greater than -2. All of the temperatures are located to the right of -2.
Question (iv) :
How many other numbers have the same relationship to -2 as the temperatures in question (ii) ? Give some examples.
Solution :
Infinitely many.
Because, the lowest temperature ever recorded in Florida was -2 °F.
So, if we take any number, it will be greater than -2.
Examples : 1, 2, 8.5, 10
Question (v) :
Suppose you could graph all of the possible answers to question (iv) on a number line. What would the graph look like ?
Solution :
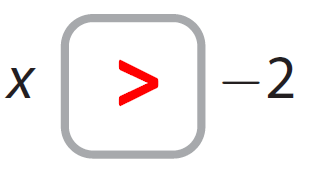
A ray extending to the right of -2, but not including -2.
Because all the numbers in question (iv) are greater than -2.
Question (vi) :
Let x represent all the possible answers to question (iv).
Complete this inequality :
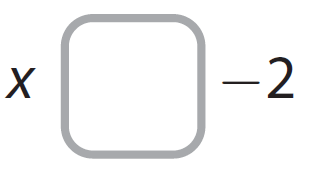
Solution :
Subscribe to our ▶️ YouTube channel 🔴 for the latest videos, updates, and tips.
Kindly mail your feedback to v4formath@gmail.com
We always appreciate your feedback.
About Us | Contact Us | Privacy Policy
©All rights reserved. onlinemath4all.com

Recent Articles
-
10 Hard SAT Math Questions (Part - 44)
Jan 12, 26 06:35 AM
10 Hard SAT Math Questions (Part - 44) -
US Common Core K-12 Curricum Algebra Solving Simple Equations
Jan 07, 26 01:53 PM
US Common Core K-12 Curricum Algebra Solving Simple Equations -
10 Hard SAT Math Questions (Part - 4)
Jan 05, 26 06:56 PM
 10 Hard SAT Math Questions (Part - 4)
