ANALYZING DOT PLOTS
We can use dot plots to analyze a data set, especially with respect to its center and spread.
Example 1 :
People once used body parts for measurements. For example, an inch was the width of a man’s thumb. In the 12th century, King Henry I of England stated that a yard was the distance from his nose to his outstretched arm’s thumb. The dot plot shows the different lengths, in inches, of the “yards” for students in a 7th grade class.
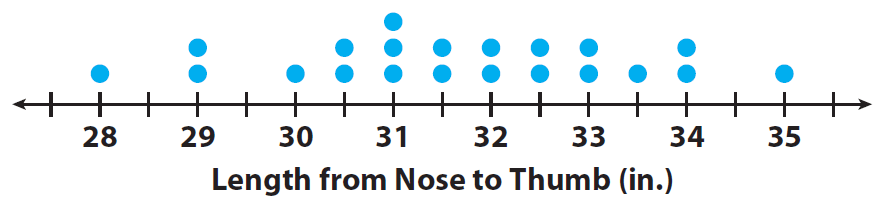
1. Describe the shape of the dot plot. Are the dots evenly distributed or grouped on one side ?
The dots are fairly evenly spread out with most in the middle.
2. Describe the center of the dot plot. What single dot would best represent the data ?
The dots are fairly evenly spread out with most in the middle.
3. Describe the spread of the dot plot. Are there any outliers ?
The data values start at 28 in. and end at 35 in. Most of the data is between 29 in. and 34 in. 28 and 35 do not look like outliers.
4. Calculate the mean, median, and range of the data in the dot plot.
Mean : about 31.6 in.
Median : 31.5 in
Range : 7 in.
Example 2 :
The dot plot shows the number of letters in the spellings of the 12 months. Use the dot plot to answer the questions given below.

1. Describe the shape of the dot plot.
The dots have a relatively even spread, with a peak at 8 letters.
2. Describe the center of the dot plot.
The center of the graph is between 6 and 7 letters.
3. Describe the spread of the dot plot.
The dots spread from 3 to 9 letters.
4. Calculate the mean, median, and range of the data in the dot plot.
Mean ≈ 6.17
Median = 6.5
Range = 6
Kindly mail your feedback to v4formath@gmail.com
We always appreciate your feedback.
©All rights reserved. onlinemath4all.com
Recent Articles
-
Digital SAT Math Problems and Solutions (Part - 150)
Apr 25, 25 11:46 AM
Digital SAT Math Problems and Solutions (Part - 150) -
AP Calculus AB Problems with Solutions (Part - 19)
Apr 24, 25 11:10 PM
AP Calculus AB Problems with Solutions (Part - 19) -
AP Calculus AB Problems with Solutions (Part - 18)
Apr 24, 25 11:06 PM
 AP Calculus AB Problems with Solutions (Part - 18)