CALCULATING EXPERIMENTAL PROBABILITY
We can use experimental probability to approximate the probability of an event. An experimental probability of an event is found by comparing the number of times the event occurs to the total number of trials. When there is only one outcome for an event, it is called a simple event.
Example :
When we toss a coin 10 times, how many times can we get head ?
When we toss a coin once, the probability of getting head is 1/2.
Since, there is 50% chance of getting head when a coin is tossed once, we can say that we will get head 5 times out of tossing a coin 10 times.
Are we 100% sure that we will get head 5 times ?
Our answer will be "NO".
When the actual experiment is conducted, the result may vary.
We may get head 0 times or 1 time or 2 times or 3 times ..........up to 10 times.
In the actual experiment of tossing a coin 10 times, say, we get head 3 times.
Then the probability of getting head is 3/10.
This is called experimental probability.
Because, here we find the probability after the experiment was conducted.
Based on the example explained above, we can get the formula given below to find experimental probability.

Practice Questions
Question 1 :
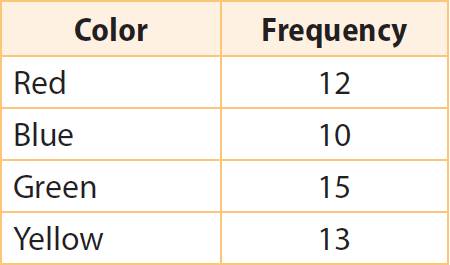
Martin has a bag of marbles. He removed one marble at random, recorded the color and then placed it back in the bag. He repeated this process several times and recorded his results in the table. Find the experimental probability of drawing each color.

Answer :
Step 1 :
Find the total no. of trials.
Total number of trials = 12 + 10 + 15 + 13 = 50
Step 2 :
Find probability for each color.
Red :
Frequency / Total no. of trials = 12/50 = 6/25
Blue :
Frequency / Total no. of trials = 10/50 = 1/5
Green :
Frequency / Total no. of trials = 15/50 = 3/10
Yellow :
Frequency / Total no. of trials = 13/50
Question 2 :
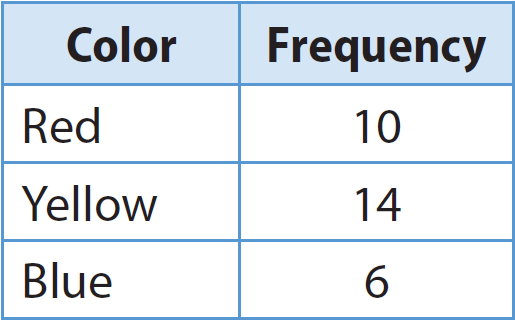
A spinner has three unequal sections: red, yellow, and blue. The table shows the results of Nolan’s spins. Find the experimental probability of landing on each color.

Answer :
Step 1 :
Find the total no. of trials.
Total number of trials = 10 + 14 + 6 = 30
Step 2 :
Find probability for each color.
Red :
Frequency / Total no. of trials = 10/30 = 1/3
Yellow :
Frequency / Total no. of trials = 14/30 = 7/15
Blue :
Frequency / Total no. of trials = 6/30 = 1/5
Question 3 :
A dentist has 400 male and female patients that range in ages from 10 years old to 50 years old and up as shown in the table. What is the experimental probability that the next patient will be female and in the age range 22–39 ?

Answer :
Step 1 :
Find the total no. of patients.
Total no. of patients is
= 44 + 66 + 32 + 53 + 36 + 50 + 45 + 74
= 400
Step 2 :
Find the no. of female patients in the age range 22 - 39.
No. of female patients in the age range 22 - 39 = 50
Step 3 :
Find the probability.

Experimental probability = 50/400
Simplify.
Experimental probability = 1/8
Kindly mail your feedback to v4formath@gmail.com
We always appreciate your feedback.
©All rights reserved. onlinemath4all.com
Recent Articles
-
Digital SAT Math Problems and Solutions (Part - 134)
Apr 02, 25 12:40 AM
Digital SAT Math Problems and Solutions (Part - 134) -
SAT Math Resources (Videos, Concepts, Worksheets and More)
Apr 02, 25 12:35 AM
SAT Math Resources (Videos, Concepts, Worksheets and More) -
Digital SAT Math Problems and Solutions (Part 135)
Apr 02, 25 12:32 AM
Digital SAT Math Problems and Solutions (Part 135)

