CONSTRUCTING LINE GRAPH
Line graphs consist of straight line segments or curves. They are used to show how one quantity varies in relation to another.
Since the quantities may take different values, we say they are variables. In general when quantities vary, one is dependent on the other.
We say that the dependent variable depends on the independent variable.
The independent variable is placed on the horizontal axis and the dependent variable is placed on the vertical axis.
Examples of Constructing Line Graph
Example 1 :
This data set shows the speed of a runner at various times during a cross country race
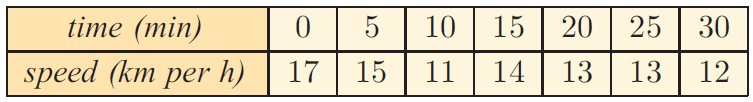
a) State which is the dependent and which is the independent variable.
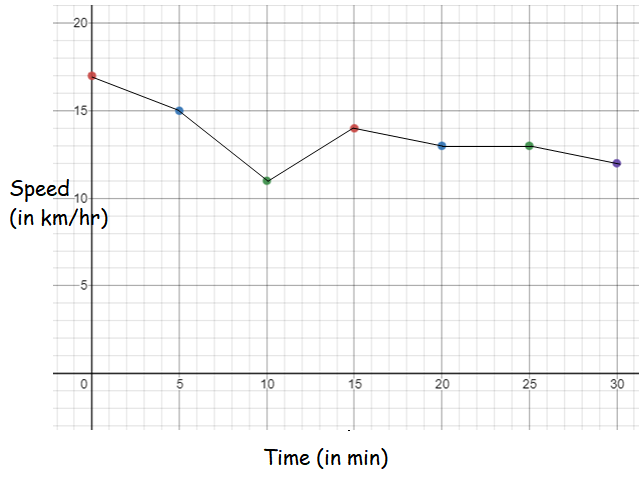
b) Draw a point graph to display the data. Make sure the independent variable is on the horizontal axis.
c) Connect the points on your graph with straight line segments to form a line graph.
Solution :
By observing the table given above,
Time - Independent variable
Speed - Dependent variable
Example 2 :
The data set below records the progress of a speed skater in a 500 m race.
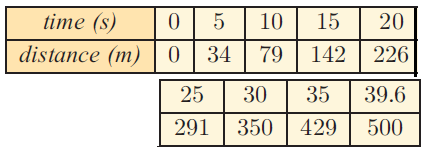
a) State which is the dependent and which is the independent variable.
b) Draw a point graph to display the data. Make sure the independent variable is on the horizontal axis.
c) Connect the points on your graph with a smooth curve.
d) Comment on whether the graph is decreasing or increasing.
Solution :
Independent variable = Time
Dependent variable = Distance
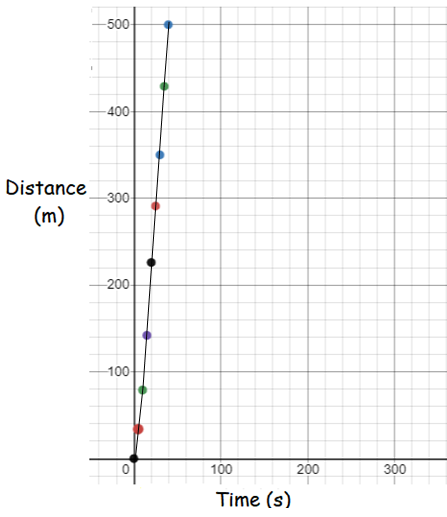
The whether is increasing.
Kindly mail your feedback to v4formath@gmail.com
We always appreciate your feedback.
©All rights reserved. onlinemath4all.com
Recent Articles
-
Digital SAT Math Problems and Solutions (Part - 144)
Apr 14, 25 07:27 PM
 Digital SAT Math Problems and Solutions (Part - 144)
 -
Quadratic Equation Problems with Solutions (Part - 1)
Apr 14, 25 11:33 AM
Quadratic Equation Problems with Solutions (Part - 1) -
Quadratic Equation Problems with Solutions (Part - 2)
Apr 14, 25 11:22 AM
Quadratic Equation Problems with Solutions (Part - 2)