CONSTRUCTING PICTOGRAPHS
Example 1 :
The number of people who visited the tourism trade fair in 5 weeks is given in the following table.
|
Week First week Second week Third week Fourth week Fifth week |
No. of People 40000 50000 60000 30000 70000 |
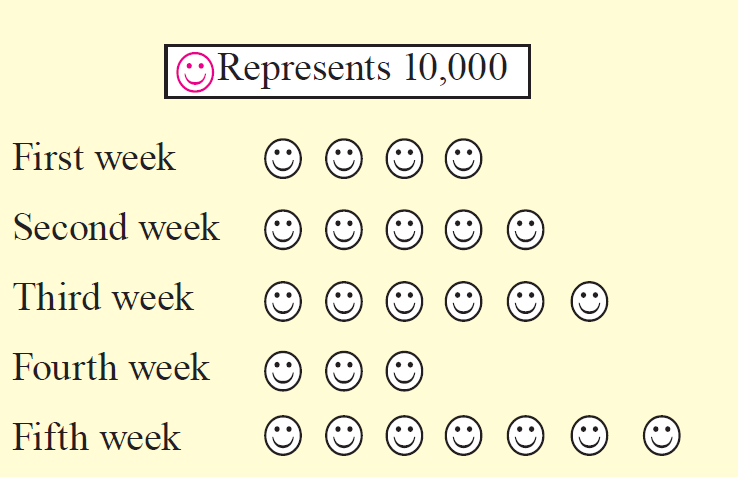
The following pictograph represents the above information.

Pictograph of the number of people who visited the tourism trade fair in 5 weeks.
1. How many of them visited the fair in the 1st week?
2. Which week had maximum visitors?
3. Which week had minimum visitors?
4. Find the total number of visitors who enjoyed the fair?
Solution :
1. 40,000 people visited in the first week.
2. Maximum people visited in the fifth week
3. Minimum people visited in the fourth week
4. Total number of visitors in the fair is 2,50,000.
Example 2 :
The manufacturing of cars in a factory during the years 2005 to 2009 is given in the following table.
|
Year 2005 2006 2007 2008 2009 |
No. of Cars 2000 3000 1000 4000 5000 |

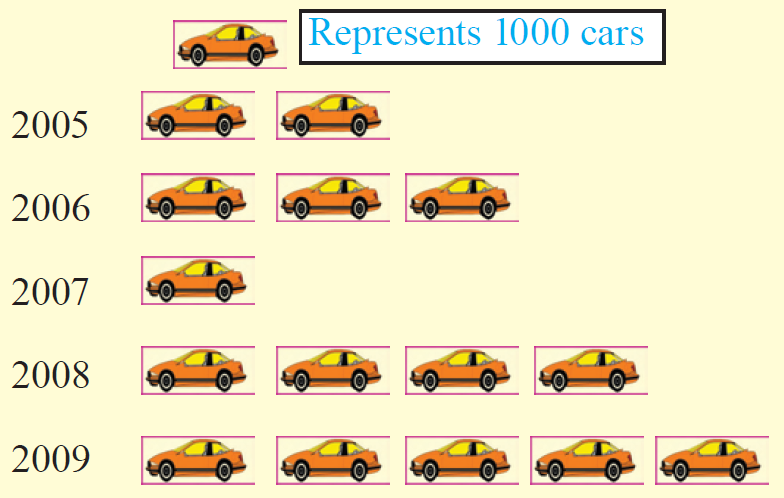
Pictograph of the manufacture of cars in a car factory during the years 2005 to 2009.
1. In which year the minimum number of cars were manufactured?
2. Find the year in which the number of cars manufactured was 3000.
3. Find the total number of cars manufactured up to 2008 (inclusive of 2008).
4. Find the total number of cars manufactured in 2008 and 2009.
Solution :
1. Minimum number of cars were manufactured in 2007.
2. 3000 cars were manufactured in 2006.
3. 10,000 cars were manufactured up to 2008.
(2000 + 3000 + 1000 + 4000 = 10,000)
4. 9000 cars were manufactured in 2008 and 2009.
Example 3 :
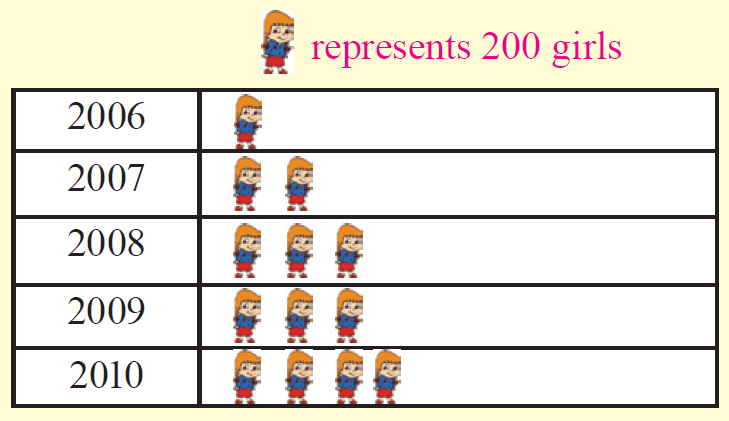
See the pictograph and answer the questions.

Pictograph of the total number of girls studied in a school in the years 2006 to 2010.
1. Find the year in which the minimum numbers of girls studied.
2. Find the year in which the maximum number of girls studied.
3. Find the year in which the number of girls studied was 600.
4. Find the difference between the maximum number of students and minimum number of students.
5. Say true or false :
Equal number of girls studied in the year 2008 and 2009.
Solution :
1. 2006
2. 2010
3. 2008, 2009
4. 600
5. True
Kindly mail your feedback to v4formath@gmail.com
We always appreciate your feedback.
©All rights reserved. onlinemath4all.com
Recent Articles
-
AP Calculus AB Problems with Solutions (Part - 6)
Jan 15, 25 07:19 PM
AP Calculus AB Problems with Solutions (Part - 6) -
Digital SAT Math Problems and Solutions (Part - 100)
Jan 14, 25 12:34 AM
Digital SAT Math Problems and Solutions (Part - 100) -
SAT Math Resources (Videos, Concepts, Worksheets and More)
Jan 14, 25 12:23 AM
SAT Math Resources (Videos, Concepts, Worksheets and More)