DIFFERENCE BETWEEN CLASS LIMIT AND CLASS BOUNDARY
To understand the difference between class limit and class boundary, let us look at the picture given below.
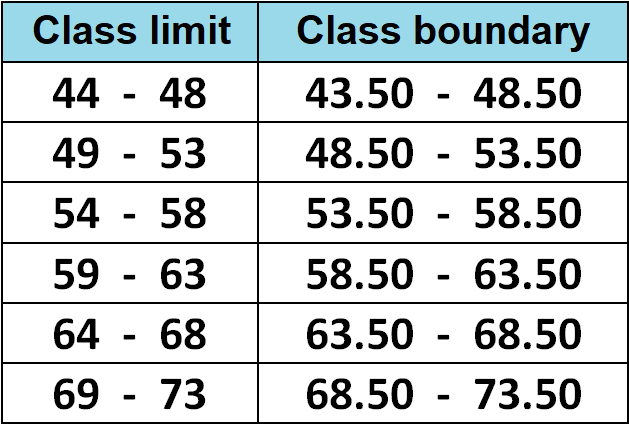
In class limit, the upper extreme value of the first class interval and the lower extreme value of the next class interval will not be equal.
In class boundary, the upper extreme value of the first class interval and the lower extreme value of the next class interval will be equal.
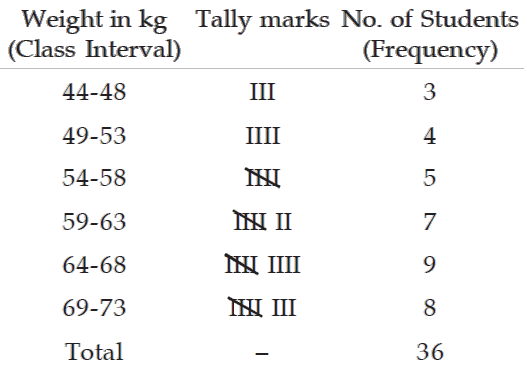
To know more about class limit and class boundary, let us look at the frequency distribution of weights of 36 students given below.
Class Limit
Corresponding to a class interval, the class limits may be defined as the minimum value and the maximum value the class interval may contain.
The minimum value is known as the lower class limit (LCL) and the maximum value is known as the upper class limit (UCL).
For the frequency distribution of weights of 36 students, the LCL and UCL of the first class interval are 44 kgs. and 48 kgs. respectively.
Class Boundary
Class boundaries may be defined as the actual class limit of a class interval.
For overlapping classification or mutually exclusive classification that excludes the upper class limits like 10–
20, 20–30, 30–40, ……… etc. the class boundaries coincide with the class limits.
This is usually done for a continuous variable. However, for non-overlapping or mutually inclusive classification that includes both the class limits like 0–9, 10–19, 20–29,…… which is usually applicable for a discrete variable, we have
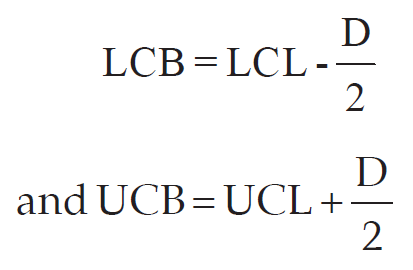
where D is the difference between the LCL of the next class interval and the UCL of the given class interval.
For the data presented in the above table, LCB of the first class interval
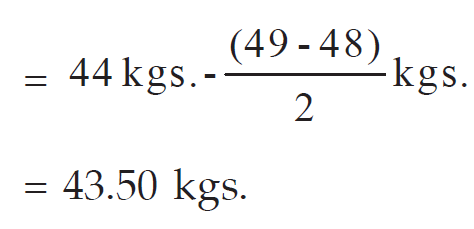
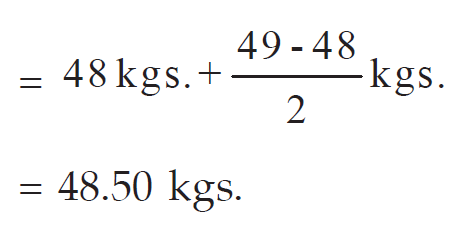
and the corresponding UCB
Apart from the stuff class limit and class boundary, let us look at the mid point of a class interval.
Mid Point or Mid Value or Class Mark
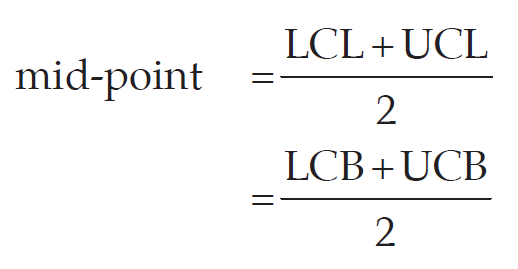
Corresponding to a class interval, this may be defined as the total of the two class limits or class boundaries to be divided by 2.
In other words, in a class interval, mid point or mid value may be defined as arithmetic mean or average of the two class limits and two class boundaries.
Thus, we have
Referring to the distribution of weight of 36 students, the mid-points for the first two class intervals are
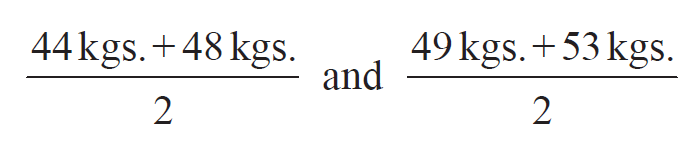
That is, 46 kgs. and 51 kgs. respectively.
Related Topics
Percentage frequency of a class interval
Relative frequency of a class interval
Frequency density of a class interval
Kindly mail your feedback to v4formath@gmail.com
We always appreciate your feedback.
©All rights reserved. onlinemath4all.com
Recent Articles
-
Digital SAT Math Problems and Solutions (Part - 146)
Apr 18, 25 06:52 AM
 Digital SAT Math Problems and Solutions (Part - 146)
 -
Logarithmic Derivative Problems and Solutions
Apr 16, 25 09:25 PM
Logarithmic Derivative Problems and Solutions -
Digital SAT Math Problems and Solutions (Part - 145)
Apr 16, 25 12:35 PM
 Digital SAT Math Problems and Solutions (Part - 145)