DRAW A BAR GRAPH TO REPRESENT THE FOLLOWING DATA
Problem 1 :
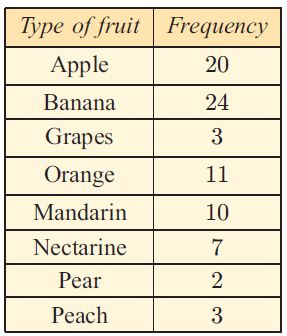
At a school, children were randomly chosen and asked to nominate their favorite fruit. The following data was collected:
(a) What are the variables in this investigation ?
(b) What is the dependent variable ?
(c) What is the sample size ?
(d) If we are trying to find out the favorite fruit of children in general, is the sample unbiased ?
(e) What is the mode ?
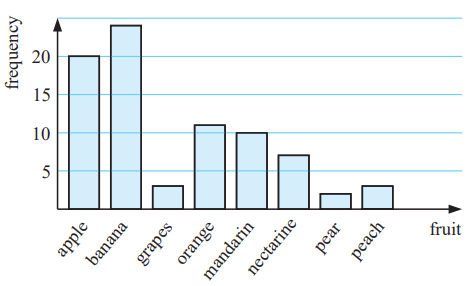
(f) Using a computer package, construct a vertical column graph to illustrate the data.
Solution :
(a) Types of variables investigated in this are
(i) types of fruit (ii) Frequency
(b) Independent variable = types of fruit
Dependent variable = Frequency
(c) Sample size = 20+24+3+11+10+7+2+3
= 80
(d) Unbiased because the sample is from the school.
(e) Frequency of banana is more, so the mode is Banana.
(f)
Problem 2 :
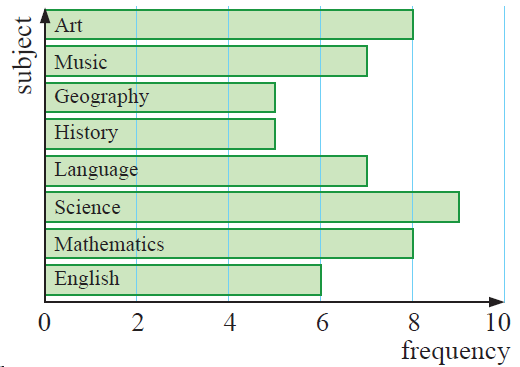
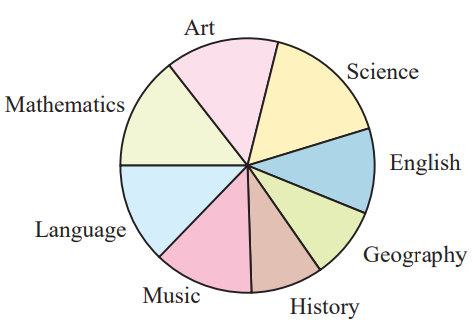
55 randomly selected Year 10 students were asked to nominate their favorite subject studied at school. The results of the survey are displayed in the bar chart shown.
a) What are the variables in this investigation?
b) What are the dependent and independent variables?
c) What is the mode?
d) Construct a pie chart for the data. If possible, use a spreadsheet.
Solution :
(a) Variables involved in this investigation are favorite subject and frequency.
(b) Independent variable is subjects and dependent variable is frequency.
(c) By observing the horizontal bar graph, the subject science with maximum frequency. So, mode is Science.
(d)
Problem 3 :
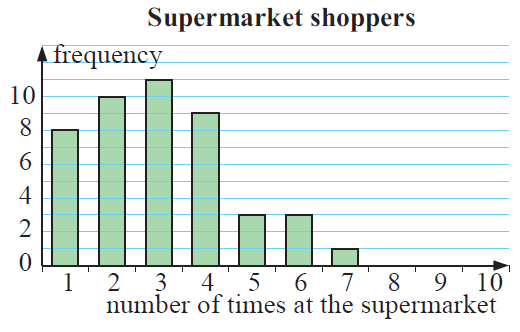
A randomly selected sample of shoppers was asked, ‘How many times did you shop at a supermarket in the past week?’ A column graph was constructed for the results.
a) How many shoppers gave data in the survey?
b) How many of the shoppers shopped once or twice?
c) What percentage of the shoppers shopped more than four times ?
d) Describe the distribution of the data.
Solution :
(a) Meaning of frequency :
8 shoppers visited once in the past week, 10 shoppers visited 2 times per week.
Number of visitors = 8+10+11+9+3+3+1
= 45 shoppers
(b) Number of shoppers visited once or twice = 8 + 10
= 18
(c) Number of shoppers visited more than four times
= 3+3+1
= 7
Percentage of visits the more than four times
= (7/45)⋅100%
= 15.55%
Approximately 15.6% of shoppers visits the shop more than four times.
(d) It is positively skewed and there is no outliers.
Problem 4 :
The number of toothpicks in a box is stated as 50 but the actual number of toothpicks has been found to vary. To investigate this, the number of toothpicks in a box was counted for a sample of 60 boxes:
50 52 51 50 50 51 52 49 50 48
51 50 47 50 52 48 50 49 51 50
49 50 52 51 50 50 52 50 53 48
50 51 50 50 49 48 51 49 52 50
49 49 50 52 50 51 49 52 52 50
49 50 49 51 50 50 51 50 53 48
a) What is the variable in this investigation?
b) Is the data continuous or discrete numerical data?
c) Construct a frequency table for this data.
d) Display the data using a bar chart.
e) Describe the distribution of the data.
f) What percentage of the boxes contained exactly 50 toothpicks?
Solution :
In the given data set, the minimum value is 48 and maximum value is 53.
47 is repeated once,48 is repeated 5 times. Like this by counting each value, we can create the table. With the help of table, we can draw bar graph.
(a) Number of toothpicks in each box is the variable investigated.
(b) It is counting number of toothpicks. So it is dicreate data.
(c)
|
Number of tooth picks in each box 47 48 49 50 51 52 53 |
Frequency 1 5 10 23 10 9 2 |
(d)
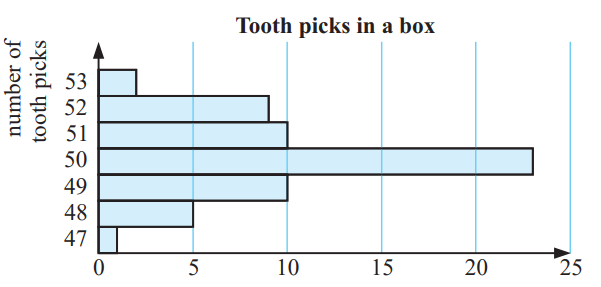
(e) Approximately symmetrical.
(f) Number of boxes which contains 50 toothpicks = 23
Percentage of boxes which contains 50 toothpicks
= (23/60)⋅100%
= 0.383 ⋅ 100%
= 38.3%
Problem 5 :
A tennis player has won the following number of matches in tournaments during the last 18 months:
1 2 0 1 3 1 4 2 1 2 3 4 0 0 1 2 2 3 2 1 6 3 2 1
1 1 1 2 2 0 3 4 1 1 2 3 0 2 3 1 4 1 2 0 3 1 2 1
a) Organise the data to form a frequency table.
b) Draw a frequency column graph of the data.
c) On what percentage of occasions did the player win less than 2 matches?
Solution :
a) Frequency table :

b)

c) Percentage of players they won 2 matches on occasion
Number of elements with 0 and 1 is 22
Converting it as percentage = (22/48) x 100%
= 45.8%
Problem 6 :
During the 2008 season Emma was very successful at scoring goals for her field hockey team. In fact on one occasion she scored 7 goals in a match. Her goal scoring results are illustrated on the graph.

a) How many games did Emma play?
b) On how many occasions did she score 4 or more goals?
c) In what percentage of games did she score:
i) less than 2 goals
ii) between 2 and 5 goals inclusive
iii) more than 4 goals?
Solution :
a) Number of games she played = 2 + 3 + 8 + 5 + 3 + 1 + 1
= 23 games
b) Number of occasion she has scored 4 or more goals
= 3 + 1 + 1
In 5 occasions, she has scored 4 or more goals.
c)
i) less than 2 goals = 2 + 3
= 5 occasions
Converting percentage = (5/23) x 100%
= 21.73%
ii) between 2 and 5 goals inclusive
= 8 + 5 + 3 + 1
= 17 occasions
Converting into percentage
= (17/23) x 100%
= 73.91%
iii) more than 4 goals = 1 + 1
= 2 occasions
Converting into percentage
= (2/23) x 100%
= 8.69%
Kindly mail your feedback to v4formath@gmail.com
We always appreciate your feedback.
©All rights reserved. onlinemath4all.com
Recent Articles
-
Digital SAT Math Problems and Solutions (Part - 117)
Feb 26, 25 12:09 PM
Digital SAT Math Problems and Solutions (Part - 117) -
SAT Math Resources (Videos, Concepts, Worksheets and More)
Feb 26, 25 12:08 PM
SAT Math Resources (Videos, Concepts, Worksheets and More) -
Digital SAT Math Problems and Solutions (Part - 118)
Feb 26, 25 12:06 PM
 Digital SAT Math Problems and Solutions (Part - 118)