EVALUATING FUNCTIONS FROM A GRAPH
Example 1 :
Given the graph of the function, find the following values:
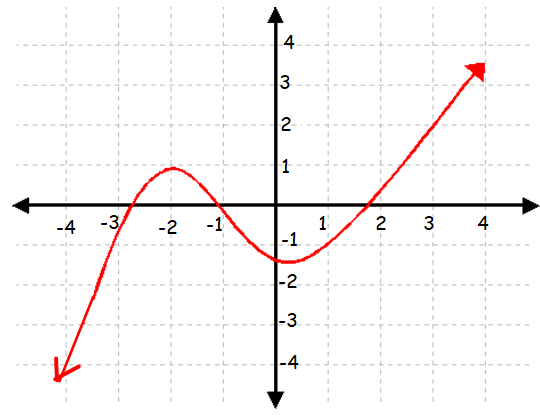
(i) f(-1) = _____
(ii) f(1) = _____
(iii) f(3) = _____
(iv) x when f(x) = -4
Solution :
(i) Trace -1 on the curve.
The curve passes through the point (-1, 0). So, the value of f(-1) is 0.
(ii) Trace 1 on the curve, the curve passes through the point (1, -1). So, the value of f(1) is -1.
(iii) Trace 3 on the curve, the curve passes through the point (3, 2). So the value of f(3) is 2.
(iv) Trace -4 on y-axis. Left side of -4 on the y-axis, we have part of the curve, we can trace the point (-4, -4) on the curve.
So, the value of x is -4, when f(x) = -4.
Example 2 :
Given the graph of the function, find the following values:
(i) f(4) = _____
(ii) f(8) = _____
(iii) f(6) = _____
(iv) x when f(x) = 2
Solution :
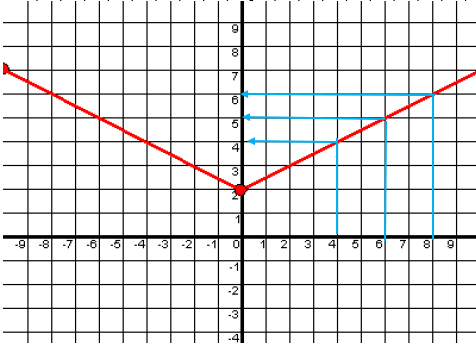
From the above graph,
(i) f(4) = 4
(ii) f(8) = 6
(iii) f(6) = 5
(iv) By observing 2 on the y-axis, the curve crosses the y-axis at the point (0, 2).
So, the value of x is 0, when f(x) = 2.
Example 3 :
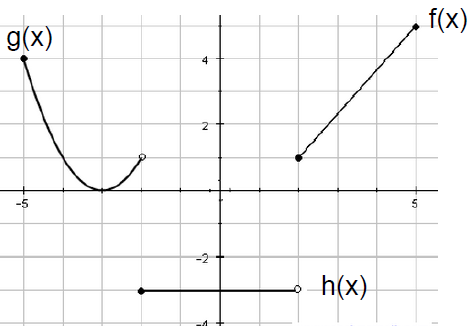
Given the graph of the function, find the following values:
(i) g(-4) = _____
(ii) f(8) = _____
(iii) g(f(2)) = _____
(iv) h(-1) = _____
(v) h(2) = ______
Solution :
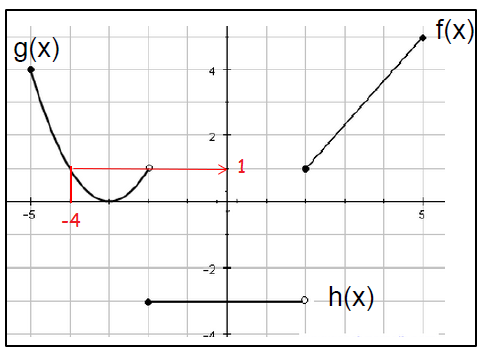
(i) On the curve g(x), straight to -4, we have 1. So, the value of g(-4) is 1.
(ii) f(8). In the curve f(x), we don't have continuity of the curve after 8. So, value of f(8) is does not exists.
(iii) g(f(2)) :
First let us evaluate f(2), by observing the graph the value of f(2) is 1.
g(f(2)) = g(1)
We don't have continuity of curve near 1. So, it does not exists.
(iv) h(-1)
Straight to -1 on the curve, we have the point -3.
So, the value h(-1) is -3.
(v) By observing the graph, the value of h(2) is -3.
Example 4 :
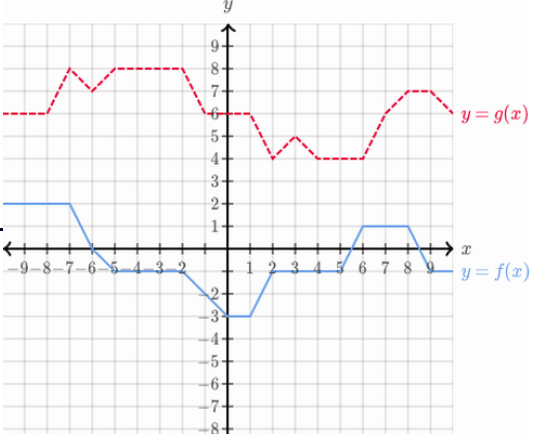
Given the graph of the function, find the following values:
(i) g(7) = ____
(ii) g(0) + f(3) = ____
(iii) f(g(7)) = _____
(iv) g(f(8)) = _____
(v) Find x if f(x) = 2
Solution :
By observing the graph,
(i) g(7) = 6
(ii) g(0) + f(3)
g(0) = 6 and f(3) = (-1)
g(0) + f(3) = 6-1 ==> 5
(iii) f(g(7))
First evaluate g(7).
g(7) = 6
f(g(7)) = f(6) ==> 1
(iv) g(f(8))
First evaluate f(8).
f(8) = 1
g(f(8)) = g(1) ==> 6
(v) Find x if f(x) = 2
When x = -7, we get the value of f(x) as 2.
Example 5 :
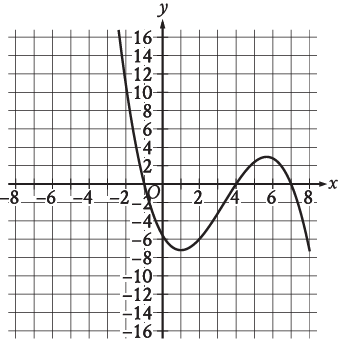
The graph y = f(x) is shown, where the function f is defined by f(x) = ax3 + bx2 + cx + d and a, b, c and d are constants. How many values of x does f(x) = 0 ?
a) One b) Two c) Three d) Four
Solution :
The given function y = f(x) is a cubic polynomial. Since its highest exponent is 3, it should intersect the x-axis at three points or it should touch the x-axis.
When it touches the x-axis but not intersecting, the repeated roots will be there.
By observing the graph above, the graph intersects the x-axis at three different points. So, the required number of values of x as 3. Option c is correct.
Example 5 :
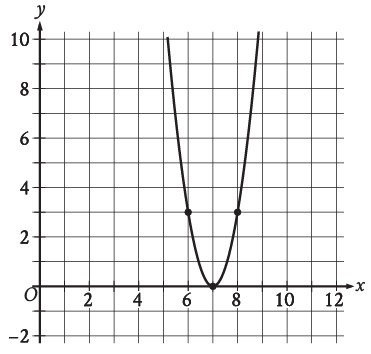
The x-intercept of the graph shown is (x, 0), what is the value of x ?
Solution :
By observing the graph, we know that the x-intercept is at (7, 0). So, the value of x is 7.
Example 6 :
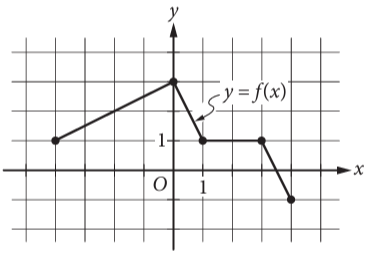
The complete graph of the function f is shown in the xy-plane above. Which of the following are equal to 1.
I) f(-4) II) f(3/2) III) f(3)
a) III only b) I and III only c) II and III only
d) I, II and III
Solution :
By drawing the horizontal line at y = 1, it intersects the curve at (-4, 1) (1, 1) and (3, 1).
So, I and III are the true statements. So, option b is correct.
Example 7 :
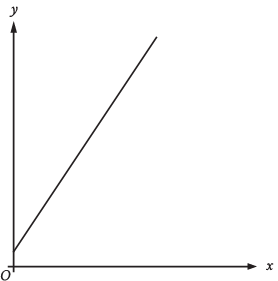
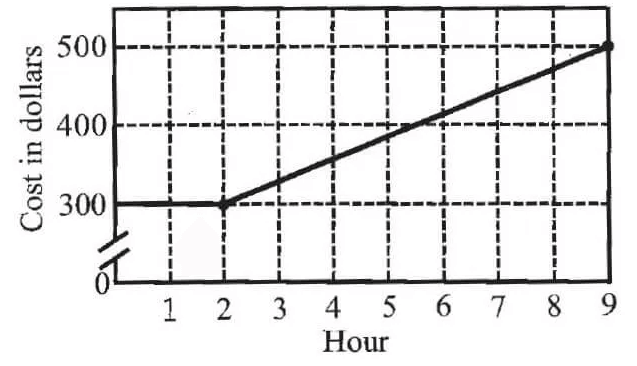
The graph represents the total charge, in dollars, by an electrician for x hours of work. The electrician charges a onetime fee plus an hourly rate. What is the best interpretation of the slope of the graph?
a) The electrician’s hourly rate
b) The electrician’s onetime fee
c) The maximum amount that the electrician charges
d) The total amount that the electrician charge
Solution :
Since the given line is a raising line, it must have positive slope. So, the total amount that the electrician charge.
Example 8 :
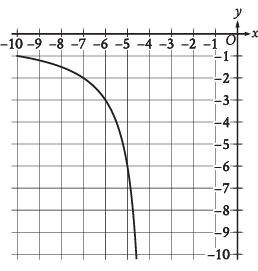
The rational function f is defined by an equation in the form f(x) = a/(x + b) , where a and b are constants. The partial graph of y = f(x) is shown. If g(x) = f(x + 4), which equation could define function g ?
a) g(x) = 6/x b) g(x) = 6/(x + 4) c) g(x) = 6/(x + 8)
d) g(x) = 6(x + 4)/(x + 4)
Solution :
g(x) = f(x + 4)
f(x) = a/(x + 4 + b)
The points on the curve are (-6, -3) and (-5, -6)
-3 = a/(-6 + 4 + b)
-3 = a/(-2 + b)
-3(-2 + b) = a
6 - 3b = a
a + 3b = 6 ------(1)
-6 = a/(-5 + 4 + b)
-6 = a/(-1 + b)
-6(-1 + b) = a
6 - 6b = a
a + 6b = 6 ------(2)
(1) - (2)
-3b = 0
b = 0
Applying the value of b in (1), we get
a + 3(0) = 6
a = 6
Applying these values in f(x), we get
f(x) = 6/(x + 4)
Example 9 :
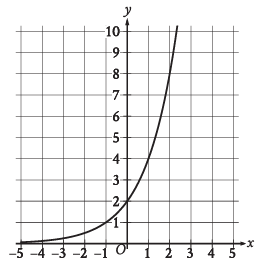
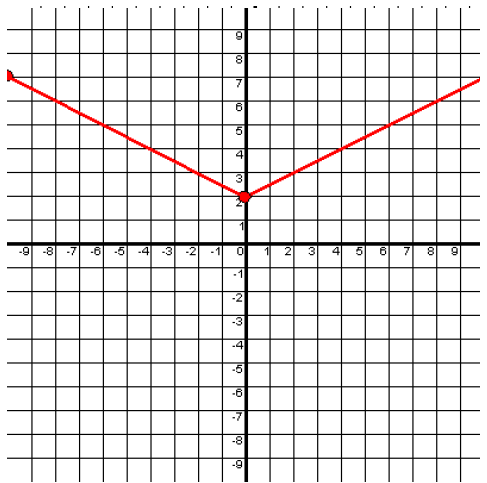
What is the y-intercept of the graph shown?
a) (0, 0) b) (0, 2) c) (2, 0) d) (2, 2)
Solution :
y-intercept is the point where it intersects the y-axis.
(0, 2) is the answer. Option b is correct.
Kindly mail your feedback to v4formath@gmail.com
We always appreciate your feedback.
©All rights reserved. onlinemath4all.com
Recent Articles
-
Digital SAT Math Problems and Solutions (Part - 146)
Apr 18, 25 06:52 AM
Digital SAT Math Problems and Solutions (Part - 146) -
Logarithmic Derivative Problems and Solutions
Apr 16, 25 09:25 PM
Logarithmic Derivative Problems and Solutions -
Digital SAT Math Problems and Solutions (Part - 145)
Apr 16, 25 12:35 PM
Digital SAT Math Problems and Solutions (Part - 145)
