EXPONENTIAL FUNCTIONS AND THEIR GRAPHS
What is exponential functions ?
Let a and b be real number constants. An exponential function in x is a function that can be written in the form
f(x) = a ⋅ bx
where a is nonzero, b is positive and b ≠ 1.
The constant a is the initial value of f (the value x = 0) and b is the base.
Let us consider the following functions,
The function f(x) = x2 and g(x) = 2x each involve a base raised to the power
Difference Between Power Function and Exponential Function
For f(x) = x2, the base is the variable x, and the exponent is the constant 2. So, f(x) is a monomial and it is power function.
For g(x) = 2x, the base is the constant , the exponent is the variable x. g is an exponential function.
Note :
Exponential functions are defined and continuous for all real numbers.
Graphs of Exponential Functions
Example 1 :
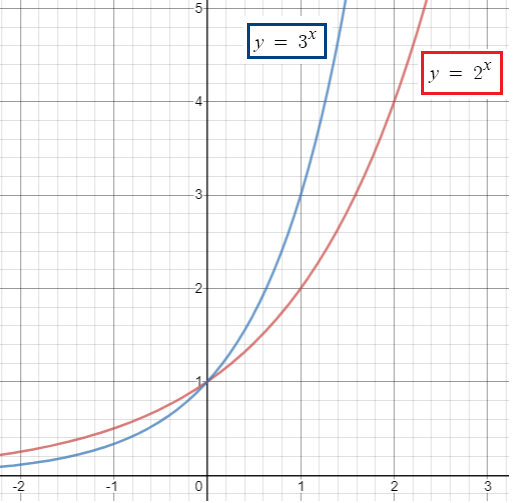
Graph each function in a viewing window [-2, 2] by [-1, 6].
(a) y1 = 2x (b) y2 = 3x
(i) Which point is common to all four graphs ?
(ii) Analyze the functions for domain, range, continuity, increasing or decreasing behavior, symmetry, extrema, asymptotes and end behaviour.
Solution :

(i) Every graph is passing through the point (0, 1).
(ii) Analyzing the function :
Domain :
Domain is the defined value of x. For this function, the domain is all real numbers.
Range :
The range is y > 0.
Continuity :
Every exponential functions are defined and continuous for all real numbers.
Increasing / decreasing :
Since the base is integer, the graph is increasing.
Symmetry :
It is symmetric about none.
Asymptotes :
The graph is asymptotic to the x-axis as x approaches negative infinity
Extreama :
The graph increases without bound as x approaches positive infinity. So there is no extreama.
End behaviour :
When x approaches x to ∞, f(x) = ∞
When x approaches x to -∞, f(x) = 0
Example 2 :
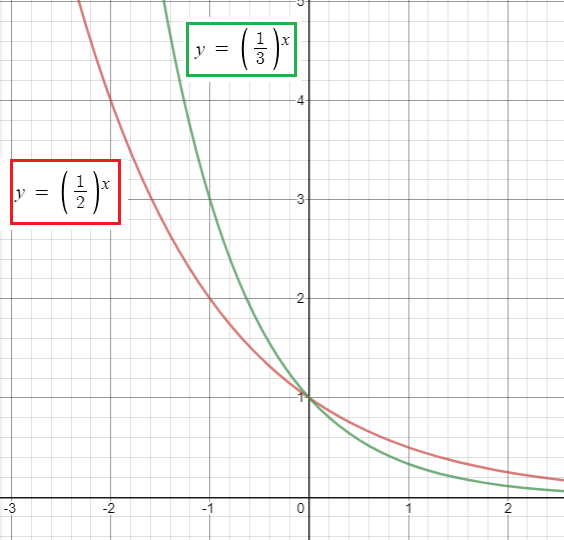
Graph each function in viewing windows [-2, 2] by [-1, 6]
(a) y1 = (1/2)x (b) y1 = (1/3)x
(i) Which point is common to all four graphs ?
(ii) Analyze the functions for domain, range, continuity, increasing or decreasing behavior, symmetry, extrema, asymptotes and end behaviour.
Solution :

(i) Every graph is passing through the point (0, 1).
(ii) Analyzing the function :
Domain :
Domain is the defined value of x. For this function, the domain is all real numbers.
Range :
The range is y > 0.
Continuity :
Every exponential functions are defined and continuous for all real numbers.
Increasing / decreasing :
Since the base is integer, the graph is increasing.
Symmetry :
It is symmetric about none.
Asymptotes :
The graph is asymptotic to the x-axis as x approaches negative infinity
Extreama :
The graph increases without bound as x approaches positive infinity. So there is no extreama.
End behaviour :
When x approaches x to -∞, f(x) = ∞
When x approaches x to ∞, f(x) = 0
Kindly mail your feedback to v4formath@gmail.com
We always appreciate your feedback.
©All rights reserved. onlinemath4all.com
Recent Articles
-
Digital SAT Math Problems and Solutions (Part - 150)
Apr 25, 25 11:46 AM
Digital SAT Math Problems and Solutions (Part - 150) -
AP Calculus AB Problems with Solutions (Part - 19)
Apr 24, 25 11:10 PM
AP Calculus AB Problems with Solutions (Part - 19) -
AP Calculus AB Problems with Solutions (Part - 18)
Apr 24, 25 11:06 PM
AP Calculus AB Problems with Solutions (Part - 18)
