FINDING THE EQUATION OF A TREND LINE
When a linear association is shown by a scatter plot, we can use a line to model the relationship between the variables. A trend line is a straight line that comes closest to the points on a scatter plot. We can use two points on a trend line to write an equation in slope-intercept form for the trend line.
Example 1 :
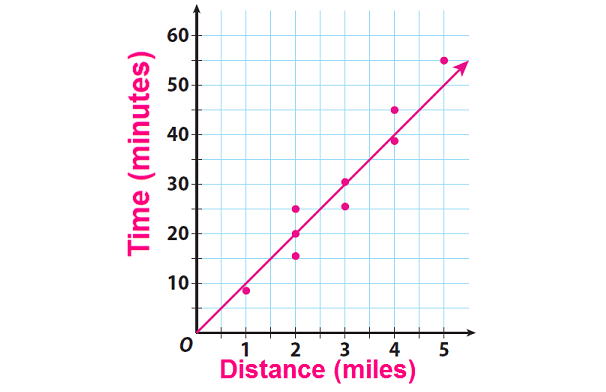
Lily is getting trained for a 10K race. For some of her training runs, she records the distance she ran and how many minutes she ran.
Distance (miles)
4
2
1
2
3
5
2
4
3
Time (minutes)
38
25
07
16
26
55
20
45
31
Draw a trend line that shows the relationship between distance and time. And also write an equation for the trend line.
Solution :
Step 1 :
Make a scatter plot of Lily’s running data.
Step 2 :
To draw a trend line, use a straight edge to draw a line that has about the same number of points above and below it. Ignore any outliers.

Step 3 :
Find the slope of the trend line.
The line passes through points (2, 20) and (4.5, 45).
Use the slope formula.
m = (y2 - y1)/(x2 - x1)
Substitute x1, = 2, y1 = 20, x2 = 4, and y2 = 45.
m = (45 - 20)/(4.5 - 2)
m = 25/2.5
m = 10
Step 4 :
Find the y-intercept of the trend line.
Slope-intercept form equation of a line :
y = mx + b
Substitute y = 20, m = 10 and x = 2.
20 = 10 · 2 + b
20 = 20 + b
Subtract 20 from both sides.
0 = b
Step 5 :
Use your slope and y-intercept values to write the equation.
Slope-intercept form equation of a line :
y = 10x + 0
So, the equation for the trend line is
y = 10x
Example 2 :
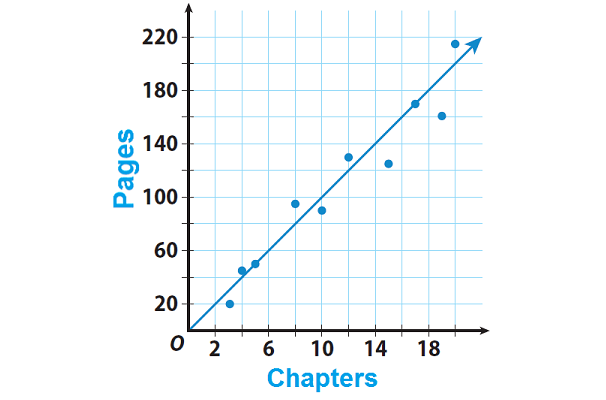
David records the number of chapters and the total number of pages for several books as given below.
No. of chapters
3
4
5
8
10
11
15
17
19
No. of pages
20
44
50
95
90
130
125
170
160
Draw a trend line that shows the relationship between the number of chapters and the number of pages. And also write an equation for the trend line.
Solution :
Step 1 :
Make a scatter plot of the data given above.
Step 2 :
To draw a trend line, use a straight edge to draw a line that has about the same number of points above and below it. Ignore any outliers.

Step 3 :
Find the slope of the trend line. The line passes through points (5, 50) and (17, 170).
Use the slope formula.
m = (y2 - y1)/(x2 - x1)
Substitute x1, = 5, y1 = 50, x2 = 17, and y2 = 170.
m = (170 - 50)/(17 - 5)
m = 120/12
m = 10
Step 4 :
Find the y-intercept of the trend line.
Slope-intercept form equation of a line :
y = mx + b
Substitute y = 50, m = 10 and x = 5.
50 = 10 · 5 + b
50 = 50 + b
Subtract 50 from both sides.
0 = b
Step 5 :
Use your slope and y-intercept values to write the equation.
Slope-intercept form equation of a line :
y = mx + b
y = 10x + 0
So, the equation for the trend line is
y = 10x
Kindly mail your feedback to v4formath@gmail.com
We always appreciate your feedback.
©All rights reserved. onlinemath4all.com
Recent Articles
-
Derivative of Absolute Value of x Using Limit Definition
Apr 23, 25 11:11 AM
Derivative of Absolute Value of x Using Limit Definition -
Digital SAT Math Problems and Solutions (Part - 149)
Apr 23, 25 02:33 AM
Digital SAT Math Problems and Solutions (Part - 149) -
Digital SAT Math Problems and Solutions (Part - 148)
Apr 22, 25 08:20 AM
Digital SAT Math Problems and Solutions (Part - 148)

