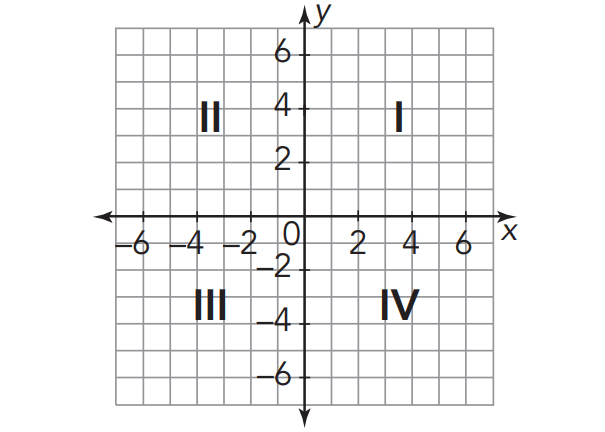
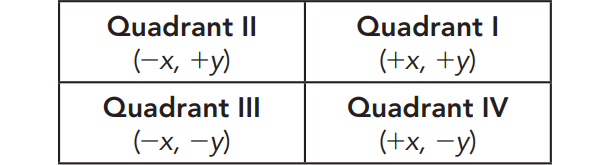
FOUR QUADRANTS OF A COORDINATE PLANE
The Cartesian coordinate plane is formed by two perpendicular number lines that intersect at the zeros, or the origin. The intersecting number lines divide the plane into four regions, called quadrants.
The quadrants are numbered with Roman numerals from one
to four (I, II, III, IV) starting in the upper right-hand quadrant and
moving counterclockwise.
To plot an ordered pair on the coordinate plane, begin at the origin (0, 0), and first move the distance along the x-axis given by the x-value of the ordered pair. Move right for a positive value and move left for a negative value. Then, move the distance along the y-axis given by the y-value of the ordered pair. Move up for a positive value and move down for a negative value.
For example, the following points are plotted on the coordinate plane :
A(24, 1)
B(21, 0)
C(26, 25)
D(2, 23)
E(0, 3)
F(5, 3)
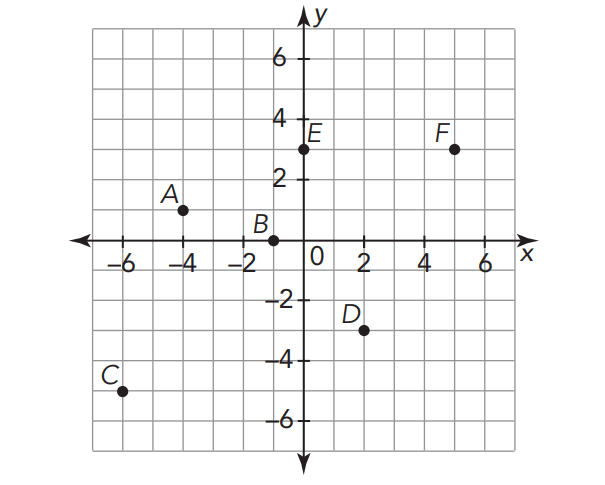
The values of the coordinates of points that are
in the same quadrant will be have the same sign
before their x- and y-values.
Reflecting a point on the coordinate plane across the x-axis results in a new point with the same x-value and the opposite y-value as the original point.
For example, reflecting point A(8, 4) across the x-axis gives point A'(8, -4). Reflecting point B(-5, -9) across the x-axis gives point B'(-5, 9).
Reflecting a point on the coordinate plane across the y-axis results in a new point with the opposite x-value and the same y-value as the original point.
For example, reflecting point C(3, 22) across the y-axis gives point A'(-3, -2). Reflecting point D(21, 0) across the y-axis gives point B'(1, 0).
You can use absolute value to determine distances on the coordinate plane.
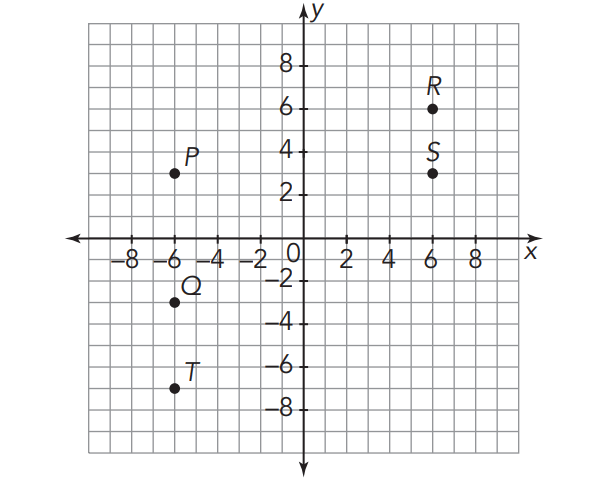
For example, the distance from point P to point Q is
|3| + |-3| = 3 + 3 = 6 units
The distance from point P to point S is
|-6| + |6| = 6 + 6 = 12 units
The distance from point R to point S is
|6| - |3| = 6 - 3 = 3 units
The distance from point Q to point T is
|-7| - |-3| = 7 - 3 = 4 units
Graphs, tables, equations, and scenarios provide various information and allow for different levels of accuracy when solving problems.
For example, the graph given shows the water level of a pool. The x-axis represents time, in hours, and the y-axis represents the water level, in inches.
The origin represents 3:00 p.m. and the desired water level.
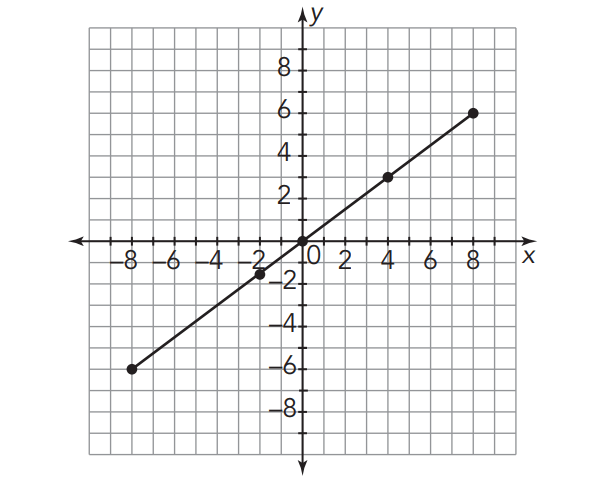
You can create a table of values for the points plotted and describe the meaning of each.
x
y
Meaning
-8
-6
At 7:00 A.M., the water level is 6 inches below the desired water level.
-2
-1½
At 1:00 P.M., the water level is 1½ inches below the desired water level.
0
0
At 3:00 P.M., the water is at the desired water level.
4
3
At 7:00 P.M., the water level is 4 inches above the desired water level.
8
6
At 11:00 P.M., the water level is 6 inches above the desired water level.
You can use the graph to determine that the water went into the pool at a rate of 3/4 inch per hour.
An equation that represents this situation would by 3
y = 3x/4
Kindly mail your feedback to v4formath@gmail.com
We always appreciate your feedback.
©All rights reserved. onlinemath4all.com
Recent Articles
-
Digital SAT Math Problems and Solutions (Part - 147)
Apr 20, 25 08:38 AM
 Digital SAT Math Problems and Solutions (Part - 147)
 -
Digital SAT Math Problems and Solutions (Part - 146)
Apr 18, 25 06:52 AM
 Digital SAT Math Problems and Solutions (Part - 146)
 -
Logarithmic Derivative Problems and Solutions
Apr 16, 25 09:25 PM
Logarithmic Derivative Problems and Solutions