GRAPH A LINEAR INEQUALITY IN THE COORDINATE PLANE
The following steps will be useful to graph a linear inequality in the coordinate plane.
Step 1 :
Consider the given inequality as equation and write the equation in slope-intercept form.
That is,
y = mx + b
Draw the boundary line using slope and y-intercept of the line.
Step 2 :
We have to use a solid line, if the given equation is having the signs ≥ or ≤.
We have to use a dotted line, if the given equation is having the signs < or >.
Step 3 :
After drawing the boundary line, we have to take a point on either sides of the line and check which point satisfies the given inequality.
We have to shade the region from where the point that satisfies the given inequality is taken.
Example 1 :
Sketch the graph of the following linear inequality.
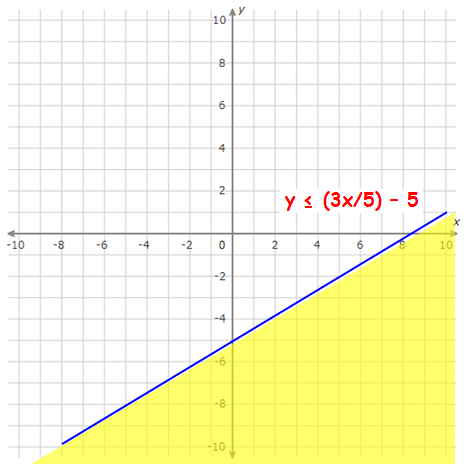
y ≤ (3x/5) - 5
Solution :
Step 1 :
Consider the given inequality as equation.
y = (3x/5) - 5
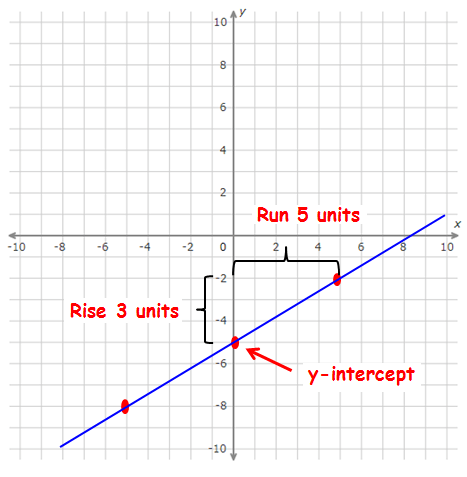
The equation above is in slope-intercept form.
Slope = 3/5
y-intercept = -5
Using the slope and y-intercept, sketch the graph of the line.

Step 2 :
Take a point on either sides of the line and check which point satisfies the given inequality.
|
Test point 1 : (5, -5) x = 5 and y = -5 y ≤ (3x/5) - 5 -5 ≤ (3(5)/5) - 5 -5 ≤ (15/5) - 5 -5 ≤ 3 - 5 -5 ≤ - 2 true |
Test point 2 : (-5, -4) x = -5 and y = -4 y ≤ (3x/5) - 5 -4 ≤ (3(-5)/5) - 5 -4 ≤ (-15/5) - 5 -4 ≤ -3 - 5 -4 ≤ -8 false |
Step 3 :
From the above step, the point (5, -5) satisfies the inequality.
So, we have to shade the region from where the point (5, -5) is taken.

Example 2 :
Sketch the graph of the following linear inequality.
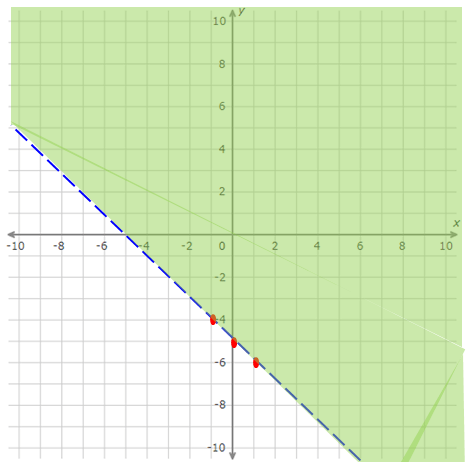
y > -x - 5
Solution :
As we have done in example 1, we can do steps 1, 2 and 3 and get the graph of the inequality as shown below.

Kindly mail your feedback to v4formath@gmail.com
We always appreciate your feedback.
©All rights reserved. onlinemath4all.com
Recent Articles
-
Digital SAT Math Problems and Solutions (Part - 144)
Apr 14, 25 07:27 PM
Digital SAT Math Problems and Solutions (Part - 144) -
Quadratic Equation Problems with Solutions (Part - 1)
Apr 14, 25 11:33 AM
Quadratic Equation Problems with Solutions (Part - 1) -
Quadratic Equation Problems with Solutions (Part - 2)
Apr 14, 25 11:22 AM
Quadratic Equation Problems with Solutions (Part - 2)
