GRAPHING EXPONENTIAL FUNCTIONS
Graphing Exponential Growth Functions
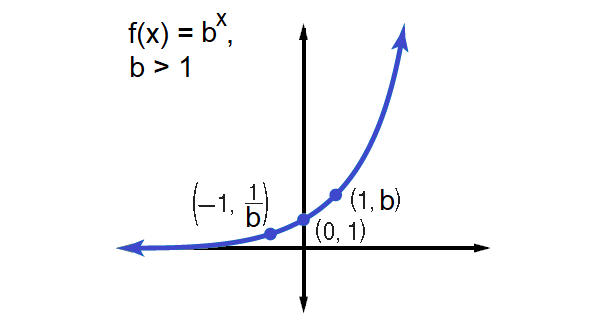
Parent Functions :
y = bx, b>1
Type of Graph :
Continuous, one-to-one and increasing
Domain :
All real numbers
Range :
All positive real numbers
Asymptote :
x-axis
Intercept :
(0, 1)
Example 1 :
Graph y = 3x. State the domain and range.
Solution :
Make a table of values. Then plot the points and sketch the graph.
|
x |
y = 3x |
|
-3 |
3-3 = 1/27 |
|
-2 |
3-2 = 1/9 |
|
-1 |
3-1 = 1/3 |
|
0 |
30 = 1 |
|
1 |
31 = 3 |
|
3/2 |
33/2 = √27 |
|
2 |
32 = 9 |
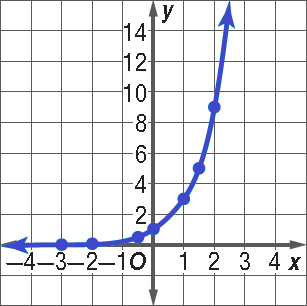
The domain is all real numbers and the range is all positive real numbers.
Example 2 :
Graph the following function. State the domain and range.
y = 2x + 1
Solution :
The equation represents a translation of the graph y = 2x one unit up.
Make a table of values. Then plot the points and sketch the graph.
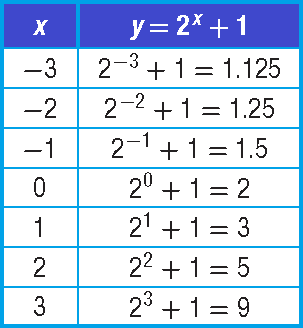
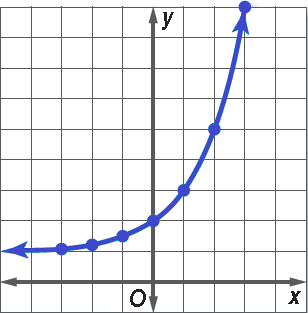
Domain = {all real numbers}
Range = {y | y > 1}
Example 3 :
Graph the following function. State the domain and range.
y = -1/2 ⋅ 5x-2
Solution :
The equation represents a translation of the graph y = 5x
Graph y = 5x and transform the graph.
(i) a = -1/2; The graph is reflected in the x-axis and compressed vertically.
(ii) h = 2; The graph is translated 2 units to the right.
(iii) k = 0; The graph is not translated vertically.
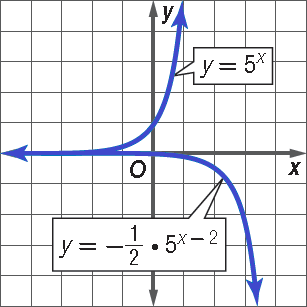
Domain = {all real numbers}
Range = {y | y < 1}
Example 4 :
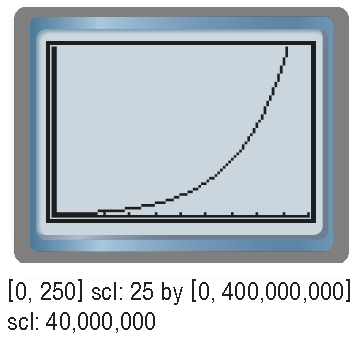
The first census was conducted in America in the year 1970. At that time, the population was 3, 929, 214. Since then, the population of America has grown by approximately 2.03% annually. Draw a graph showing the population growth of America since 1970.
Solution :
First, write an equation using a = 3,929,214 and r = 0.0203
y = 3,929,214(1 + 0.0203)t
y = 3,929,214(1.0203)t
Now, graph the equation.
Graphing Exponential Decay Functions
The second type of exponential function is exponential decay.
Parent Functions :
y = bx, 0<b<1
Type of Graph :
Continuous, one-to-one and decreasing
Domain :
All real numbers
Range :
Positive real numbers
Asymptote :
x-axis
Intercept :
(0, 1)
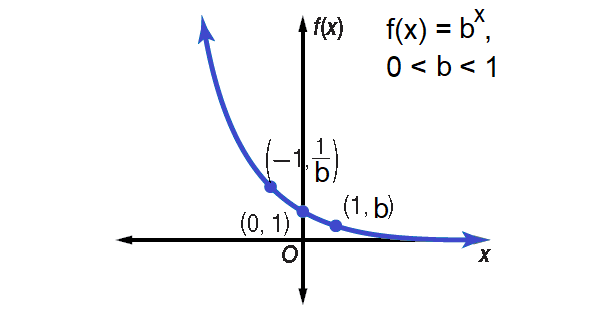
The graphs of exponential decay functions can be transformed in the same manner as those of exponential growth.
Example 5 :
Graph the following function. State the domain and range.
y = (1/3)x
Solution :
Make a table of values. Then plot the points and sketch the graph.
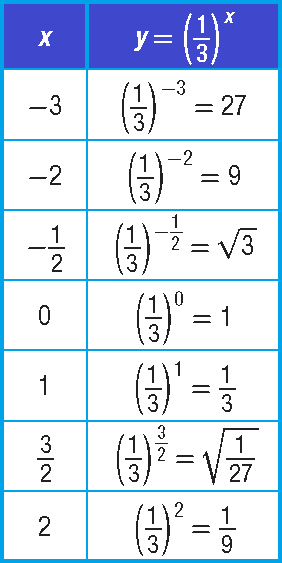
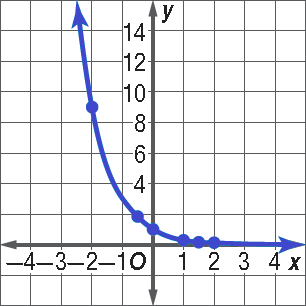
The domain is all real numbers and the range is all positive real numbers.
Example 6 :
Graph the following function. State the domain and range.
y = 2(1/4)x+2 - 3
Solution :
The equation represents a transformation of the graph :
y = (1/4)x
Examine each parameter.
(i) a = 2; The graph is streched vertically.
(ii) h = -2; The graph is translated 2 units left.
(iii) k = -3; The graph is translated 3 units vertically.
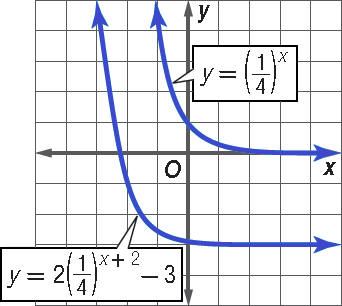
The domain is all real numbers and the range is all real numbers greater than -3.
Example 7 :
35 milligrams of caffeine is contained in a cup of green tea. Approximately 12.5% of the caffeine can be eliminated by the average teen from their per hour.
(a) Draw a graph to represent the amount of caffeine left over after drinking a cup of green tea.
(b) Estimate the amount of caffeine in the body of a teen ager 3 hours after drinking a cup of green tea.
Solution (a) :
y = a( 1 - r)t
Substitute.
y = 35( 1 - 0.125)t
y = 35(0.875)t
Graph the equation :
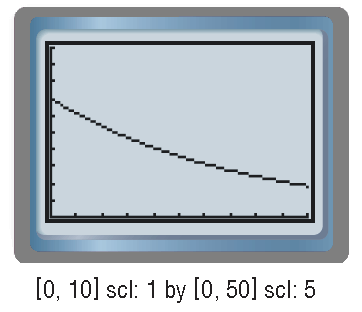
Solution (b) :
Equation from part (a) :
y = 35(0.875)t
Substitute 3 for t.
y = 35(0.875)3
Use calculator.
y ≈ 23.45
The caffeine in the body of a teenager will be about 23.45 milligrams after 3 hours.
Kindly mail your feedback to v4formath@gmail.com
We always appreciate your feedback.
©All rights reserved. onlinemath4all.com
Recent Articles
-
Digital SAT Math Problems and Solutions (Part - 150)
Apr 25, 25 11:46 AM
Digital SAT Math Problems and Solutions (Part - 150) -
AP Calculus AB Problems with Solutions (Part - 19)
Apr 24, 25 11:10 PM
AP Calculus AB Problems with Solutions (Part - 19) -
AP Calculus AB Problems with Solutions (Part - 18)
Apr 24, 25 11:06 PM
AP Calculus AB Problems with Solutions (Part - 18)
