GRAPHING FROM A TABLE TO WRITE AN EQUATION
We can use information from a table to draw a graph of a linear relationship and to write an equation for the graphed line.
Example 1 :
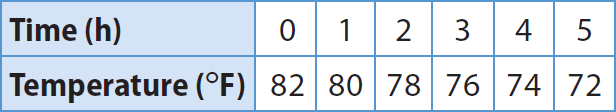
The table shows the temperature of a fish tank during an experiment. Graph the data, and find the slope and y-intercept from the graph. Then write the equation for the graph in slope-intercept form.
Solution :
Step 1 :
Ordered pairs from the table (time, temperature) :
(0, 82), (1, 80), (2, 78), (3, 76), (4, 74) and (5, 72).
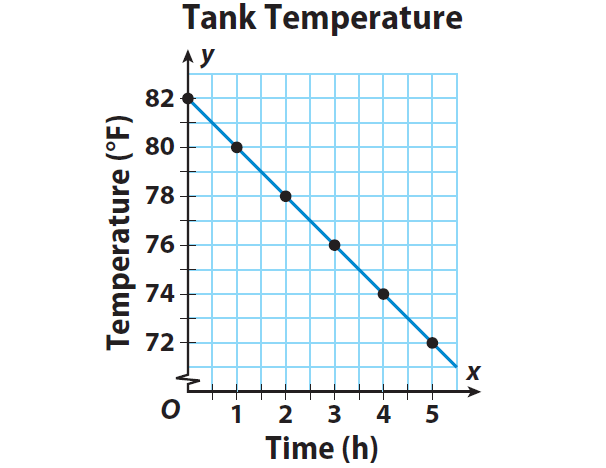
Plot the above points (ordered pairs) on a graph paper.
Step 2 :
Connect all the points which have been plotted on a graph paper.
Step 3 :
Choose any two points on the line to find the slope :
For example, let us choose (0, 82) and (1, 80).
Use the slope formula.
m = (y2 - y1) / (x2 - x1)
Substitute :
(x1, y1) = (0, 82)
(x2, y2) = (1, 80)
Then,
m = (80 - 82) / (1 - 0)
m = 2 / 1
m = 2
Step 4 :
Read the y-intercept (b) from the table or graph.
That is, the value of 'y' when x = 0.
or
The level of temperature when time = 0.
b = 82
Step 5 :
Now, we can use the slope and y-intercept values to write equation of the line in slope-intercept form.
The slope-intercept form equation of a line is
y = mx + b
Substitute m = 2 and b = 82.
y = -2x + 82
Example 2 :
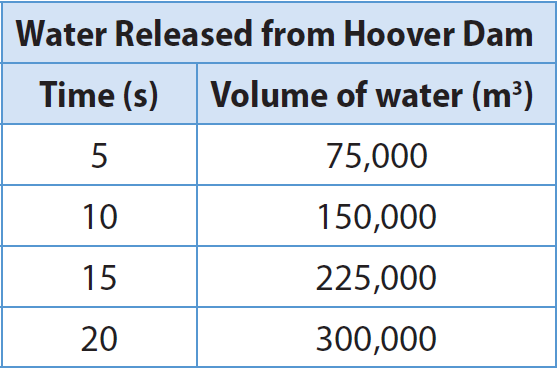
The table shows the temperature of a fish tank during an experiment. Graph the data, and find the slope and y-intercept from the graph. Then write the equation for the graph in slope-intercept form.
Solution :
Step 1 :
Ordered pairs from the table (time, temperature) :
(0, 75,000), (10, 150,000), (15, 225,000), (20, 300,000)
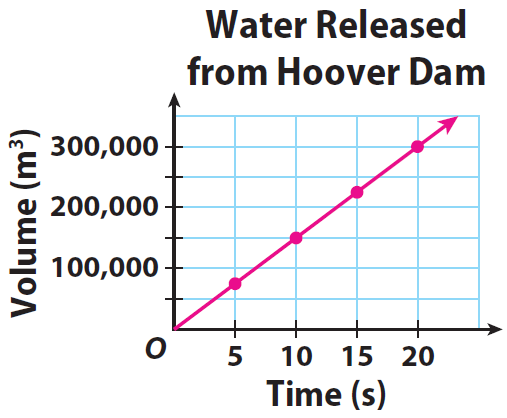
Plot the above points (ordered pairs) on a graph paper.
Step 2 :
Connect all the points which have been plotted on a graph paper.
Step 3 :
Choose any two points on the line to find the slope :
For example, let us choose (5, 75,000) and (10, 150,000).
Use the slope formula.
m = (y2 - y1) / (x2 - x1)
Substitute :
(x1, y1) = (5, 75000)
(x2, y2) = (10, 150000)
Then,
m = (150,000 - 75,000) / (10 - 5)
m = 75,000 / 5
m = 15,000
Step 4 :
Read the y-intercept (b) from the table or graph.
That is, the value of 'y' when x = 0.
or
The volume of water when time = 0.
b = 0
Step 5 :
Now, we can use the slope and y-intercept values to write equation of the line in slope-intercept form.
The slope-intercept form equation of a line is
y = mx + b
Substitute m = 15,000 and b = 0.
y = 15,000x + 0
y = 15,000x
Kindly mail your feedback to v4formath@gmail.com
We always appreciate your feedback.
©All rights reserved. onlinemath4all.com
Recent Articles
-
Digital SAT Math Problems and Solutions (Part - 147)
Apr 20, 25 08:38 AM
 Digital SAT Math Problems and Solutions (Part - 147)
 -
Digital SAT Math Problems and Solutions (Part - 146)
Apr 18, 25 06:52 AM
 Digital SAT Math Problems and Solutions (Part - 146)
 -
Logarithmic Derivative Problems and Solutions
Apr 16, 25 09:25 PM
Logarithmic Derivative Problems and Solutions