GRAPHING FUNCTIONS USING VERTICAL AND HORIZONTAL SHIFTS
We can follow the steps given below to graph a function using vertical and horizontal shifts.
Step 1 :
For the given function, identify the basic function.
Step 2 :
Find the points for the basic functions by taking some random values for x as shown below.
x = ....., -2, -1, 0, 1, 2,.....
Step 3 :
Using the points found in step 2, graph the basic function.
Step 4 :
Apply the vertical and horizontal shifts on the graph of the basic function to get the graph of the given function.
Example 1 :
Sketch the graph of
g(x) = |x + 2|
Solution :
The basic function for the given function is
f(x) = |x|
or
y = |x|
To find the points on the basic function, take some random values for x and find the corresponing values for y.
When x = -2,
y = |-2| = 2
When x = -1,
y = |-1| = 1
When x = 0,
y = |0| = 0
When x = 1,
y = |1| = 1
When x = 2,
y = |2| = 2

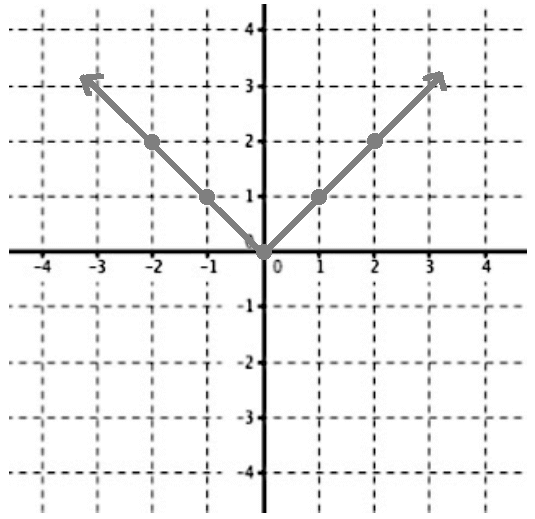
Points on the graph of the basic function :
(-2, 2), (-1, 1), (0, 0), (1, 1), (2, 2)
Graph of the basic function f(x) = |x| :
g(x) = |x + 2|
Since f(x) = |x|, we have
g(x) = f(x + 2)
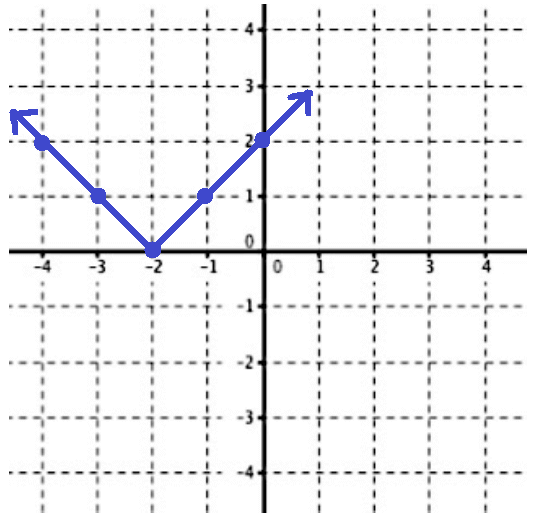
Here, 2 is added to x. So, there is an horizontal shift of 2 units to the left.
We have to shif the graph of the basic function 2 units to the left to get the graph of g(x) = |x + 2|.
Graph of g(x) = |x + 2| :
Example 2 :
Sketch the graph of
h(x) = √x + 2
Solution :
The basic function for the given function is
f(x) = √x
or
y = √x
Here, √x is defined for x ≥ 0.
To find the points on the basic function, take some random values for x and find the corresponing values for y.
When x = 0,
y = √0 = 0
When x = 1,
y = √1 = 1
When x = 4,
y = √4 = 2

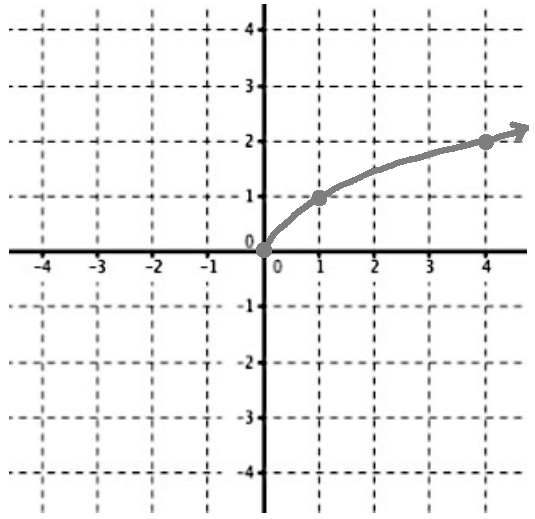
Points on the graph of the basic function :
(0, 0), (1, 1), (4, 2)
Graph of the basic function f(x) = √x :
h(x) = √x + 2
Since f(x) = √x, we have
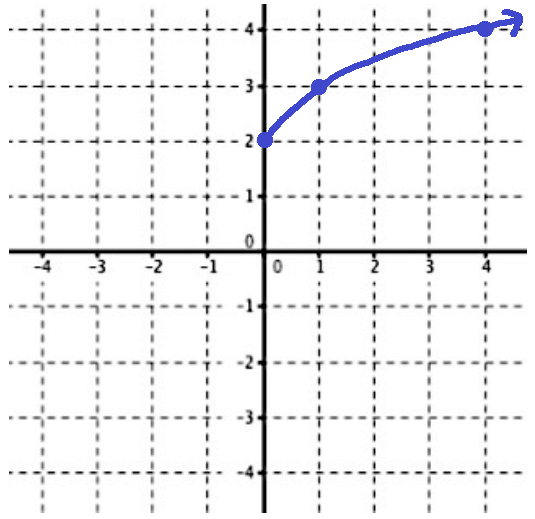
h(x) = f(x) + 2
Here, 2 is added to f. So, there is a vertical shift of 2 units up.
We have to shif the graph of the basic function 2 units up to get the graph of h(x) = √x + 2.
Graph of h(x) = √x + 2 :
Example 3 :
Sketch the graph of
j(x) = x2 + 2
Solution :
The basic function for the given function is
f(x) = x2
or
y = x2
To find the points on the basic function, take some random values for x and find the corresponing values for y.
When x = -2,
y = (-2)2 = 4
When x = -1,
y = (-1)2 = 1
When x = 0,
y = 02 = 0
When x = 1,
y = (-1)2 = 1
When x = 2,
y = (-2)2 = 4

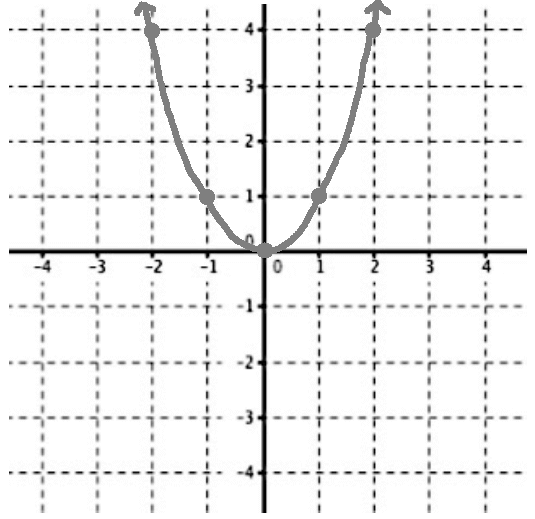
Points on the graph of the basic function :
(-2, 4), (-1, 1), (0, 0), (1, 1), (2, 4)
Graph of the basic function f(x) = x2 :
j(x) = x2 + 2
Since f(x) = x2, we have
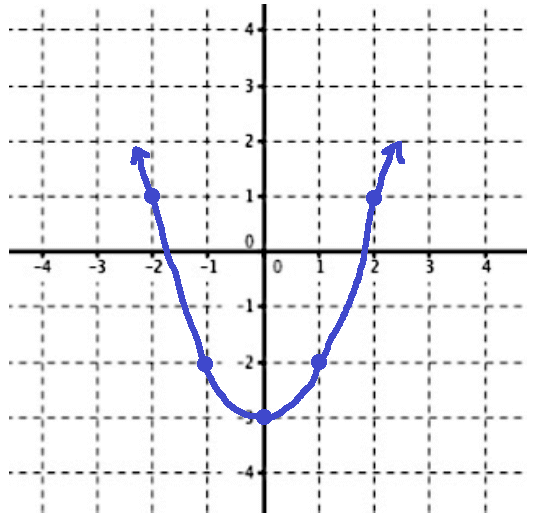
j(x) = f(x) + 2
Here, 2 is added to j. So, there is a vertical shift of 2 units up.
We have to shif the graph of the basic function 2 units up to get the graph of j(x) = x2 + 2.
Graph of j(x) = x2 + 2 :
Example 4 :
Sketch the graph of
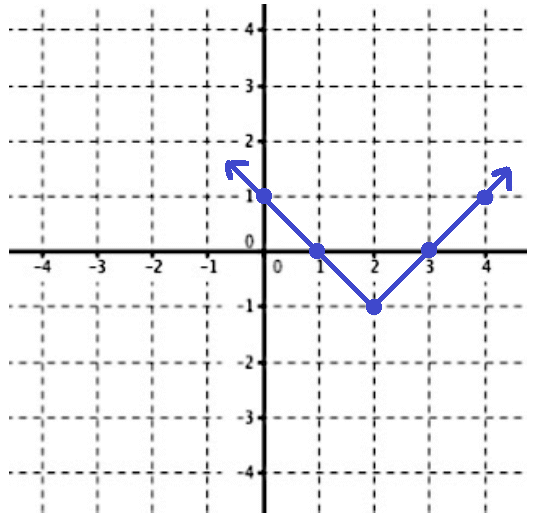
k(x) = |x - 2| - 1
Solution :
The basic function for the given function is
f(x) = |x|
or
y = |x|
To find the points on the basic function, take some random values for x and find the corresponing values for y.
When x = -2,
y = |-2| = 2
When x = -1,
y = |-1| = 1
When x = 0,
y = |0| = 0
When x = 1,
y = |1| = 1
When x = 2,
y = |2| = 2

Points on the graph of the basic function :
(-2, 2), (-1, 1), (0, 0), (1, 1), (2, 2)
Graph of the basic function f(x) = |x| :

k(x) = |x - 2| - 1
Since f(x) = |x|, we have
g(x) = f(x - 2) - 1
Here, 2 is added to x. So, there is an horizontal shift of 2 units to the left.
1 is subtracted from f. So, there is a vertical shift of 1 unit down.
We have to shif the graph of the basic function 2 units to the right and 1 unit up to get the graph of
k(x) = |x - 2| - 1
Graph of k(x) = |x - 2| - 1 :
Kindly mail your feedback to v4formath@gmail.com
We always appreciate your feedback.
©All rights reserved. onlinemath4all.com
Recent Articles
-
Digital SAT Math Problems and Solutions (Part - 146)
Apr 18, 25 06:52 AM
Digital SAT Math Problems and Solutions (Part - 146) -
Logarithmic Derivative Problems and Solutions
Apr 16, 25 09:25 PM
Logarithmic Derivative Problems and Solutions -
Digital SAT Math Problems and Solutions (Part - 145)
Apr 16, 25 12:35 PM
Digital SAT Math Problems and Solutions (Part - 145)
