GRAPHING FUNCTIONS
Subscribe to our ▶️ YouTube channel 🔴 for the latest videos, updates, and tips.
One of the ways to understand functions is to graph them. You can graph a function by finding ordered pairs that satisfy the function.
Graphing Solutions Given a Domain
Graph each function for the given domain.
Example 1 :
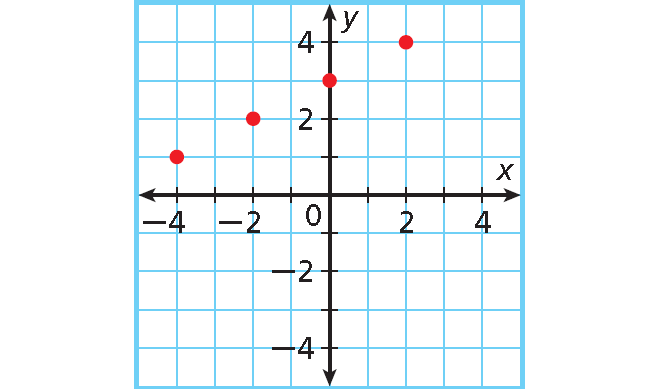
2y - x = 6; D: {-4, -2, 0, 2}
Solution :
Step 1 :
Because the values of the domain are given, or x, solve for y.
2y - x = 6
Add x to each side.
2y = x + 6
Divide each side by 2.
y = (x + 6)/2
y = x/2 + 3
Step 2 :
x
y = x/2 + 3
(x, y)
-4
-2
0
2
4
-4/2 + 3 = 1
-2/2 + 3 = 2
0/2 + 3 = 3
2/2 + 3 = 4
4/2 + 3 = 5
(-4, 1)
(-2, 2)
(0, 3)
(2, 4)
(4, 5)
Step 1 :
Graph the ordered pairs.
Example 2 :
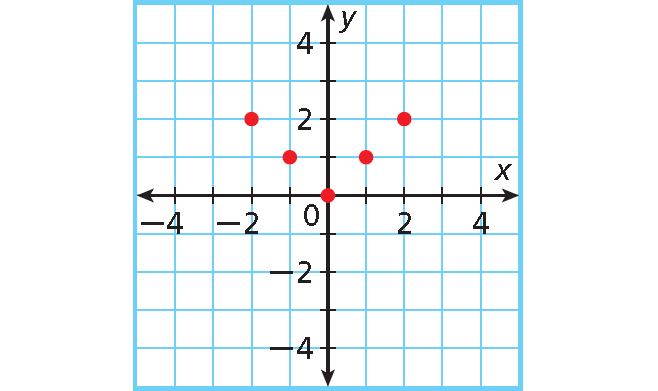
f(x) = |x|; D: {-2, -1, 0, 1, 2}
Solution :
Step 1 :
Use the given values of domain to find values of f(x).
x
f(x) = |x|
(x, y)
-2
-1
0
1
2
f(-2) = |-2| = 2
f(-1) = |-1| = 1
f(0) = |0| = 0
f(1) = |1| = 1
f(2) = |2| = 2
(-2, 2)
(-1, 1)
(0, 0)
(1, 1)
(2, 2)
Step 2 :
Graph the ordered pairs.
If the domain of a function is all real numbers, any number can be used as an input value. This process will produce an infinite number of ordered pairs that satisfy the function. Therefore, arrowheads are drawn at both “ends” of a smooth line or curve to represent the infinite number of ordered pairs. If a domain is not given, assume that the domain is all real numbers.
Graphing Functions Using a Domain of All Real Numbers
Step 1 :
Use the function to generate ordered pairs by choosing several values for x.
Step 2 :
Plot enough points to see a pattern for the graph.
Step 1 :
Connect the points with a line or smooth curve.
Graphing Functions
Graph each function.
Example 3 :
y = 2x + 1
Solution :
Step 1 :
Choose several values of x and generate ordered pairs.
x
y = 2x + 1
(x, y)
-3
-2
-1
0
1
2
3
y = 2(-3) + 1 = -5
y = 2(-2) + 1 = -3
y = 2(-1) + 1 = -1
y = 2(0) + 1 = 1
y = 2(1) + 1 = 3
y = 2(2) + 1 = 5
y = 2(3) + 1 = 7
(-3, -5)
(-2, -3)
(-1, -1)
(0, 1)
(1, 3)
(2, 5)
(3, 7)
Step 2 :
Plot enough points to see a pattern.
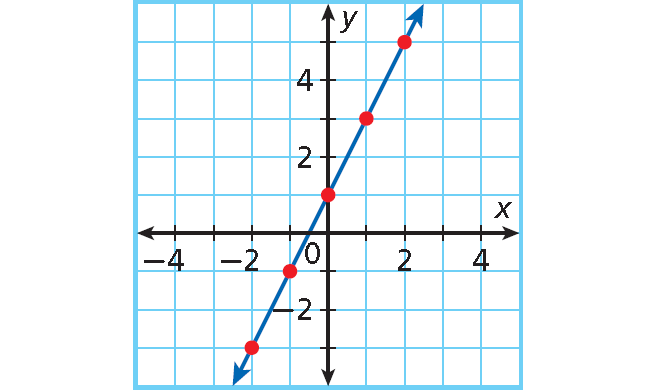
Step 3 :
The ordered pairs appear to form a line. Draw a line through all the points to show all the ordered pairs that satisfy the function. Draw arrowheads on both “ends” of the line.
Example 4 :
y = x2
Solution :
Step 1 :
Choose several values of x and generate ordered pairs.
x
y = x2
(x, y)
-3
-2
-1
0
1
2
y = 9
y = 4
y = 1
y = 0
y = 1
y = 4
(-3, 9)
(-2, 4)
(-1, 1)
(0, 0)
(1, 1)
(2, 4)
Step 2 :
Plot enough points to see a pattern.
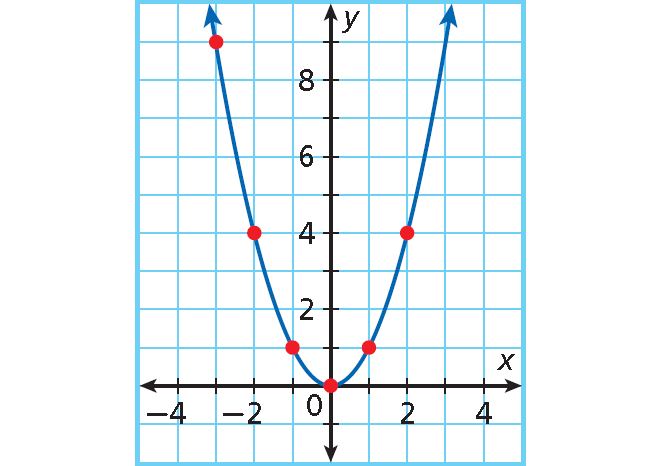
Step 3 :
The ordered pairs appear to form an almost U-shaped graph. Draw a smooth curve through the points to show all the ordered pairs that satisfy the function. Draw arrowheads on the “ends” of the curve.
Check :
If the graph is correct, any point on it will satisfy the function. Choose an ordered pair on the graph that was not in your table, such as (3, 9).
Check whether it satisfies y = x2.
Substitute the values for x and y into the function. Simplify.
y = x2
9 = 32
9 = 9 ✓
The ordered pair (3, 9) satisfies the function.
Finding Values Using Graphs
Example 5 :
Use a graph of the function f(x) = x/3 + 2 to find the value of f(x) when x = 6. Check your answer.
Solution :
Locate 6 on the x-axis. Move up to the graph of the function. Then move left to the y-axis to find the corresponding value of y.
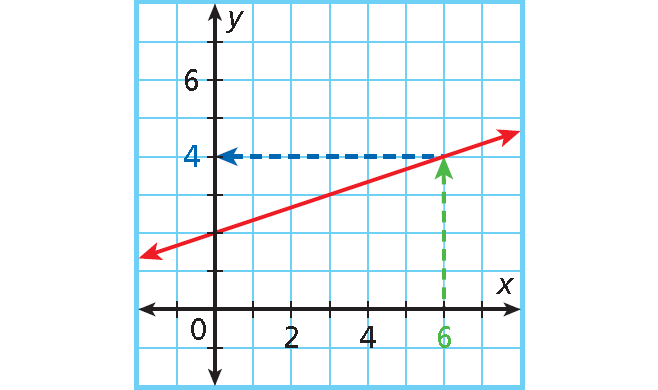
f(x) = 4
Check :
Use substitution.
f(x) = x/3 + 2
Substitute the values for x and y into the function.
4 = 6/3 + 2
4 = 2 + 2
4 = 4 ✓
The ordered pair (4, 6) satisfies the function.
Recall that in real-world situations you may have to limit the domain to make answers reasonable. For example, quantities such as time, distance, and number of people can be represented using only nonnegative values. When both the domain and the range are limited to nonnegative values, the function is graphed only in Quadrant I.
Problem Solving Application
Example 6 :
The function y = 2.5x describes how many millimeters sea level y rises in x years. Graph the function. Use the graph to estimate how many millimeters sea level will rise in 3.5 years.
Solution :
Understand the Problem
The answer is a graph that can be used to find the value of y when x is 3.5.
List the important information :
• The function y = 2.5x describes how many millimeters sea level rises.
Make a Plan
Think :
What values should I use to graph this function? Both, the number of years sea level has risen and the distance sea level rises, cannot be negative. Use only nonnegative values for both the domain and the range. The function will be graphed in Quadrant I.
Solve
Choose several nonnegative values of x to find values of y. Then graph the ordered pairs.
x
y = 2.5x
(x, y)
0
1
2
3
4
y = 2.5(0) = 0
y = 2.5(1) = 2.5
y = 2.5(2) = 5
y = 2.5(3) = 7.5
y = 2.5(4) = 10
(0, 0)
(1, 2.5)
(2, 5)
(3, 7.5)
(4, 10)
Draw a line through the points to show all the ordered pairs that satisfy this function.
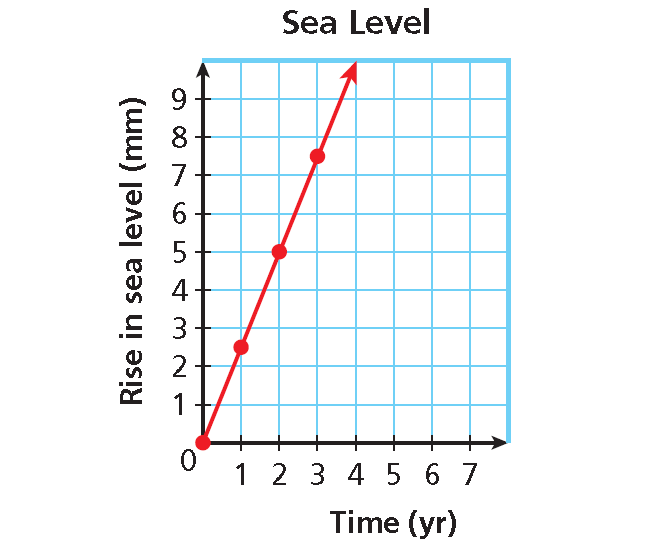
Use the graph to estimate the y-value when x is 3.5. Sea level will rise about 8.75 millimeters in 3.5 years.
Look Back
As the number of years increases, sea level also increases, so the graph is reasonable. When x is between 3 and 4, y is between 7.5 and 10. Since 3.5 is between 3 and 4, it is reasonable to estimate y to be 8.75 when x is 3.5.
Subscribe to our ▶️ YouTube channel 🔴 for the latest videos, updates, and tips.
Kindly mail your feedback to v4formath@gmail.com
We always appreciate your feedback.
About Us | Contact Us | Privacy Policy
©All rights reserved. onlinemath4all.com

Recent Articles
-
Digital SAT Math Questions and Answers (Part - 13)
May 10, 26 05:50 PM
 Digital SAT Math Questions and Answers (Part - 13)
 -
Problems on Solving Logarithmic Equations
Apr 24, 26 09:30 PM
Problems on Solving Logarithmic Equations -
Solving Logarithmic Equations Worksheet
Apr 24, 26 09:05 PM
 Solving Logarithmic Equations Worksheet

