GRAPHING LINES IN SLOPE INTERCEPT FORM WORKSHEET
Subscribe to our ▶️ YouTube channel 🔴 for the latest videos, updates, and tips.
Problem 1 :
Graph : y = 2x - 1.
Problem 2 :
Graph : 2x + y = 7.
Problem 3 :
Graph : 3x - 2y = 4.
Problem 4 :
Graph : -4x + 2y = 8.

Answers
1. Answer :
y = 2x - 1
This equation is in slope-intercept form.
Graphing :
Step 1 :
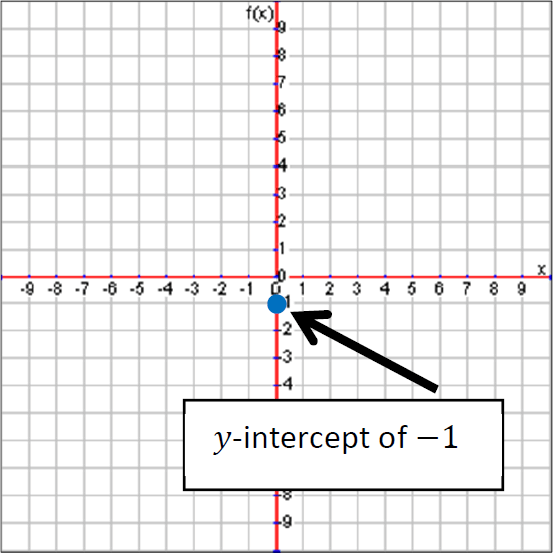
The y-intercept is -1, so we plot a point at -1 on the y-axis to begin.
Step 2 :
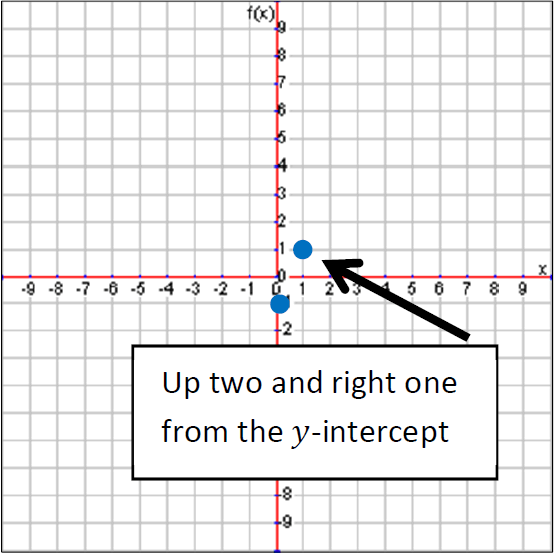
Next, the slope is 2 which means a rise of 2 and a run of 1. So we’ll move up two and right one to plot the next point.
Step 3 :
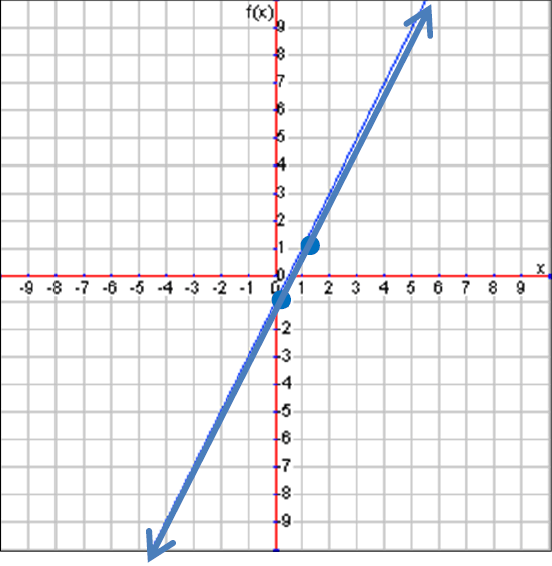
Finally, connect the dots with a line. This completes the graph of our linear function.
2. Answer :
2x + y = 7
This equation is not in slope-intercept form. We’ll need to rearrange the equation to get it into slope-intercept form.
2x + y = 7
Subtract 2x from both sides.
y = -2x + 7
Graphing :
Step 1 :
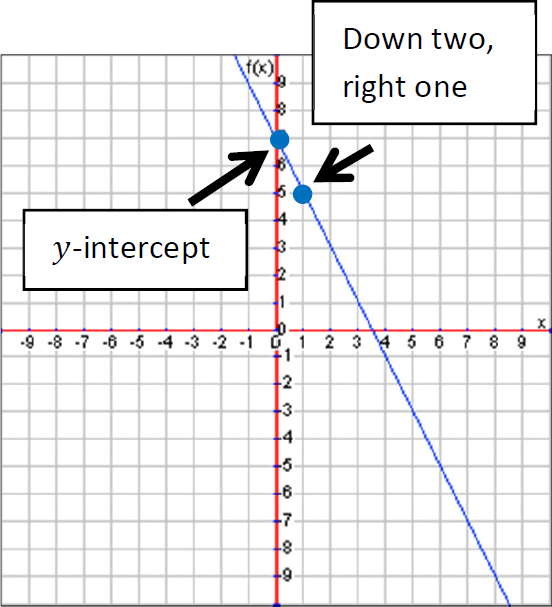
The y-intercept is 7, so we plot a point at 7 on the y-axis to begin.
Step 2 :
Next, the slope is -2 which means a rise of 2 and a run of 1. Since the slope is negative, we’ll move down two and right one to plot the next point.
Step 3 :
Finally, connect the dots with a line. This completes the graph of our linear function.
3. Answer :
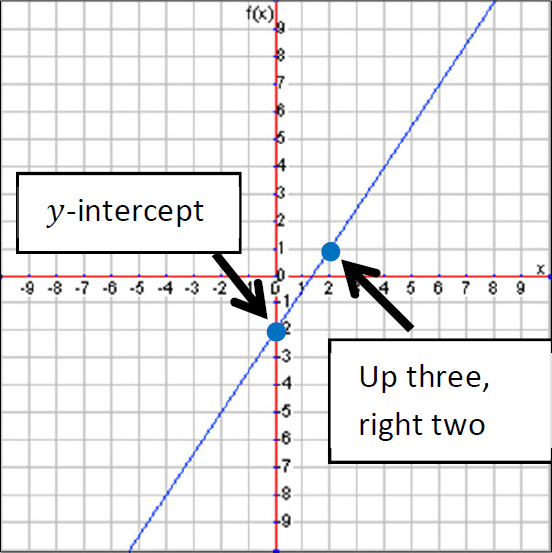
3x - 2y = 4
This equation is not in slope-intercept form. We’ll need to rearrange the equation to get it into slope-intercept form.
3x - 2y = 4
Subtract 3x from both sides.
-2y = -3x + 4
Divide both sides by -2.
y = (-3x + 4)/(-2)
y = -3x/(-2) + 4/(-2)
y = (3/2)x - 2
Graphing :
Step 1 :
The y-intercept is -2, so we plot a point at -2 on the y-axis to begin.
Step 2 :
Next, the slope is 3/2 which means a rise of 3 and a run of 2. So we’ll move up three and right two to plot the next point.
Step 3 :
Finally, connect the dots with a line. This completes the graph of our linear function.
4. Answer :
-4x + 2y = 8
This equation is not in slope-intercept form. We’ll need to rearrange the equation to get it into slope-intercept form.
-4x + 2y = 8
Add 4x to both sides.
2y = 4x + 8
Divide both sides by 2.
y = (4x + 8)/2
y = 4x/2 + 8/2
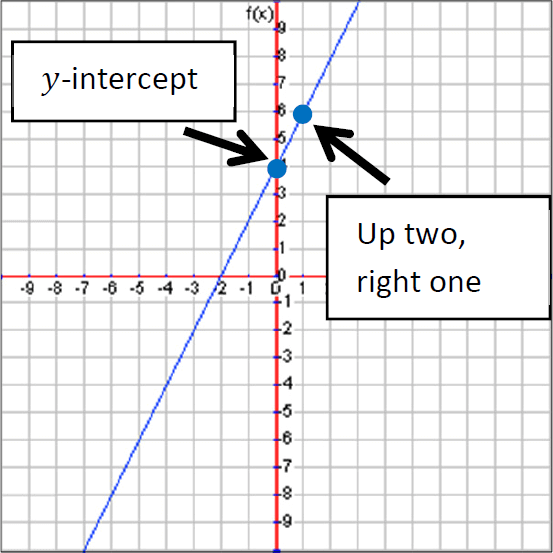
y = 2x + 4
Graphing :
Step 1 :
The y-intercept is 2, so we plot a point at 2 on the y-axis to begin.
Step 2 :
Next, the slope is 2 which means a rise of 2 and a run of 1. So we’ll move up two and right one to plot the next point.
Step 3 :
Finally, connect the dots with a line. This completes the graph of our linear function.
Subscribe to our ▶️ YouTube channel 🔴 for the latest videos, updates, and tips.
Kindly mail your feedback to v4formath@gmail.com
We always appreciate your feedback.
About Us | Contact US | Privacy Policy
©All rights reserved. onlinemath4all.com
Recent Articles
-
10 Hard SAT Math Questions (Part - 39)
Dec 11, 25 05:59 PM
10 Hard SAT Math Questions (Part - 39) -
10 Hard SAT Math Questions (Part - 38)
Dec 08, 25 12:12 AM
10 Hard SAT Math Questions (Part - 38) -
SAT Math Practice
Dec 05, 25 04:04 AM
SAT Math Practice - Different Topics - Concept - Formulas - Example problems with step by step explanation

