GRAPHING POLAR EQUATIONS r EQUAL TO a COS n THETA IN POLAR GRID
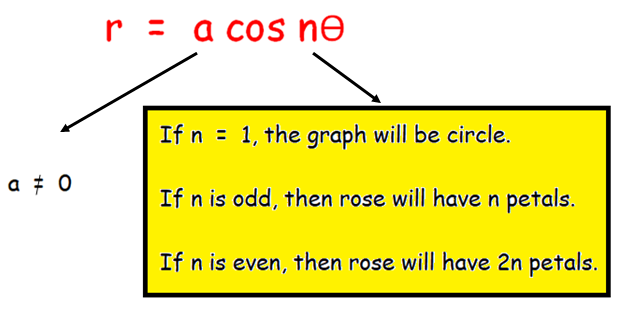
The graph of the polar equation which in the form of
r = a cos nθ
(or)
r = a sin nθ
will produce rose curves. They are called rose curves because the loops that are formed by resemble petals.
Maximum r value is |a|.
Note :
If it is cosine function one or more leaves lie on the y axis.
Example 1 :
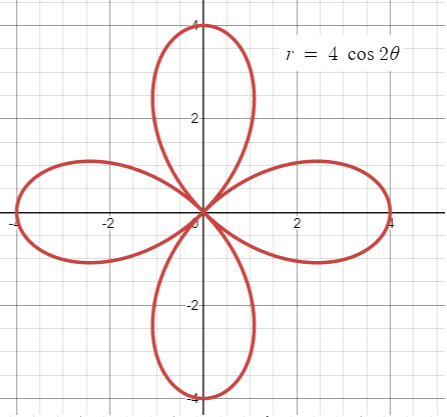
Draw the graph of r = 4 cos 2θ.
Solution :
a = 4, n = 2 (even). So the rose curve will have 2n petals.
That is,
2n = 2(2) ==> 4 petals
Where will be each petal ?
360 / 4 = 90
Each petal will be apart 90 degree.
|
θ = 0 r = 4 |
θ = π/2 r = 0 |
θ = π r = -4 |
θ = 2π r = 0 |
The required points are (4, 0) (0, π/2)(-4, π) and (0, 2π).
Example 2 :
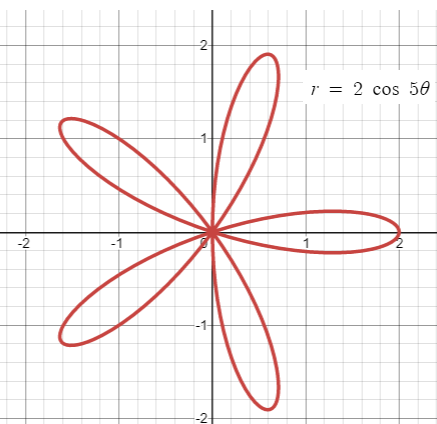
Draw the graph of r = 2 cos 5θ.
Solution :
a = 2, n = 5 (odd). So the rose curve will have 5 petals.
Where will be each petal ?
360 / 5 = 72
Each petal will be apart 72 degree.
Since it is cosine function, it will lie on the x - axis based on the value of n.
Example 3 :
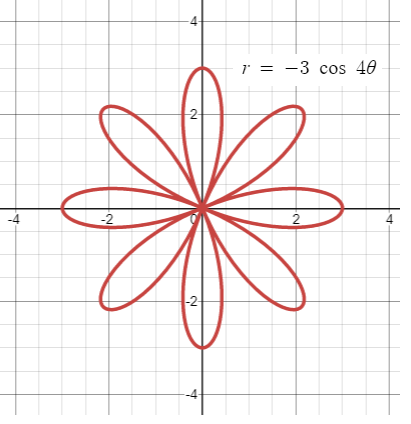
Draw the graph of r = -3 cos 4θ.
Solution :
a = 3, n = 4 (even). So the rose curve will have 2n petals.
That is,
2n = 2(4) ==> 8 petals
Where will be each petal ?
360 / 8 = 45
Each petal will be apart 45 degree.
Since it is cosine function, it will lie on the x - axis based on the value of n.
So the positions of petals are 0, 45, 90, 135, 180, 225, 270, 315, 360.
Kindly mail your feedback to v4formath@gmail.com
We always appreciate your feedback.
©All rights reserved. onlinemath4all.com
Recent Articles
-
Digital SAT Math Problems and Solutions (Part - 150)
Apr 25, 25 11:46 AM
Digital SAT Math Problems and Solutions (Part - 150) -
AP Calculus AB Problems with Solutions (Part - 19)
Apr 24, 25 11:10 PM
AP Calculus AB Problems with Solutions (Part - 19) -
AP Calculus AB Problems with Solutions (Part - 18)
Apr 24, 25 11:06 PM
AP Calculus AB Problems with Solutions (Part - 18)
