GRAPHING QUADRATIC FUNCTIONS
A quadratic function has the form
y = ax2 + bx + c , where a ≠ 0.
The graph of a quadratic function is U-shaped and is called a parabola.
For instance, the graphs of y = x2 and y = -x2 are shown at the right. The origin is the lowest point on the graph of y = x2 and the highest point on the graph of y = -x2. The lowest or highest point on the graph of a quadratic function is called the vertex.
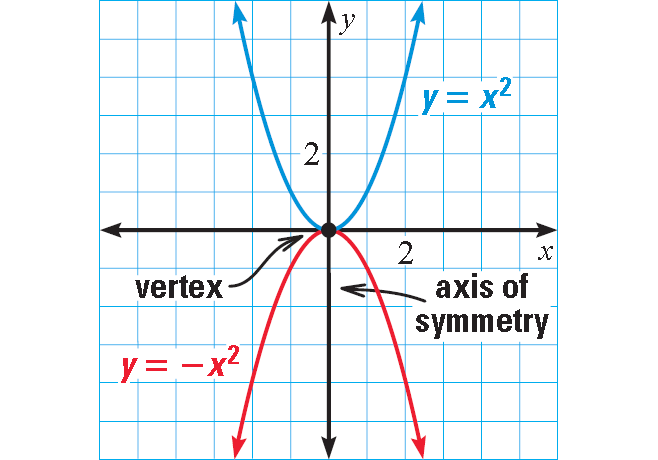
The graphs of y = x2 and y = -x2 are symmetric about the y-axis, called the axis of symmetry. In general, the axis of symmetry for the graph of a quadratic function is the vertical line through the vertex.
The Graph of a Quadratic Function
The graph of the more general function y = ax2 + bx + c is described below.
The graph of y = ax2 + bx + c is a parabola with these characteristics :
• The parabola opens up if a > 0 and opens down if a < 0. The parabola is wider than the graph of y = x2 if |a| < 1 and narrower than the graph of y = x2 if |a| > 1.
• The x-coordinate of the vertex is -b/2a.
• The axis of symmetry is the vertical line x = -b/2a.
Standard Form of a Quadratic Function
Standard form of a quadratic function is
y = ax2 + bx + c
Two other useful forms for quadratic functions are given below.
Vertex Form of a Quadratic Function
Vertex form of a quadratic function is
y = a(x - h)2 + k
Characteristics of graph :
The vertex is (h, k).
The axis of symmetry is x = h.
Intercept Form of a Quadratic Function
Intercept form of a quadratic function is
y = a(x - p)(x - q)
Characteristics of graph :
The x-intercepts are p and q.
The axis of symmetry is halfway between (p, 0) and (q, 0).
For all the three forms, the graph opens up if a > 0 and opens down if a < 0.
Graphing a Quadratic Function in Standard Form
Example 1 :
Graph : y = 2x2 - 8x + 6
Solution :
The function is in standard form y = ax2 + bx + c
a = 2, b = -8, and c = 6
Because a > 0, the parabola opens up.
Find and plot the vertex. The x-coordinate is :
x = -b/2a
Substitute.
= -(-8)/2(2)
= 8/4
= 2
The x-coordinate at the vertex is 2 and axis of symmetry is x = 2.
The y-coordinate is :
y = 2(2)2 - 8(2) + 6
= 8 - 16 + 6
= -2
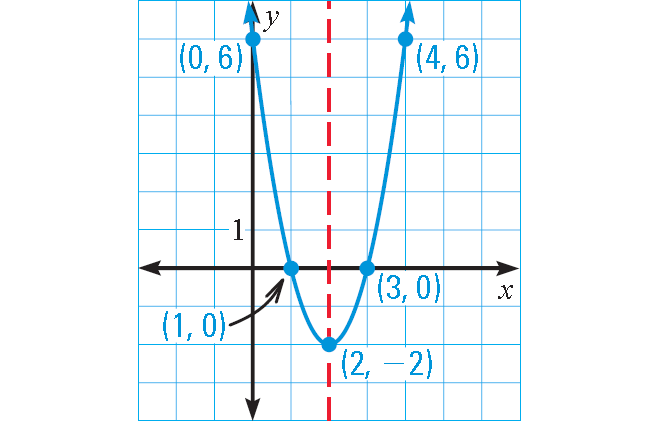
So, the vertex is (2, -2).
Draw the axis of symmetry x = 2.
Plot two points on one side of the axis of symmetry, such as (1, 0) and (0, 6). Use symmetry to plot two more points, such as (3, 0) and (4, 6).
Draw a parabola through the plotted points.
Graphing a Quadratic Function in Vertex Form
Example 2 :
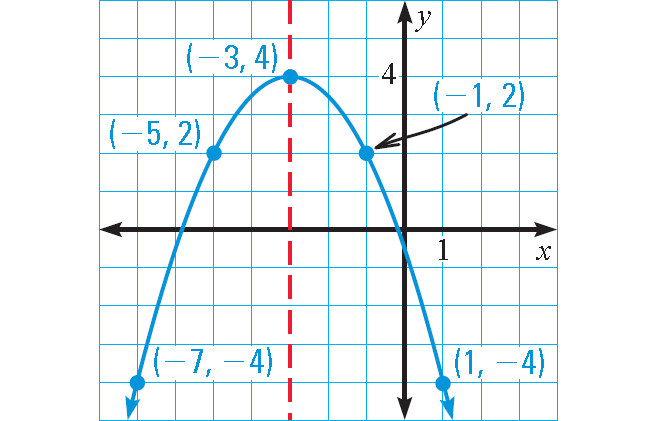
Graph : y = -½(x + 3)2 + 4
Solution :
The function is in vertex form y = a(x - h)2 + k.
a = -½, h = -3, and k = 4
Because a < 0, the parabola opens down.
To graph the function, first plot the vertex (h, k) = (-3, 4).
Draw the axis of symmetry x = -3 and plot two points on one side of it, such as (-1, 2) and (1, -4).
Use symmetry to complete the graph.
Graphing a Quadratic Function in Intercept Form
Example 3 :
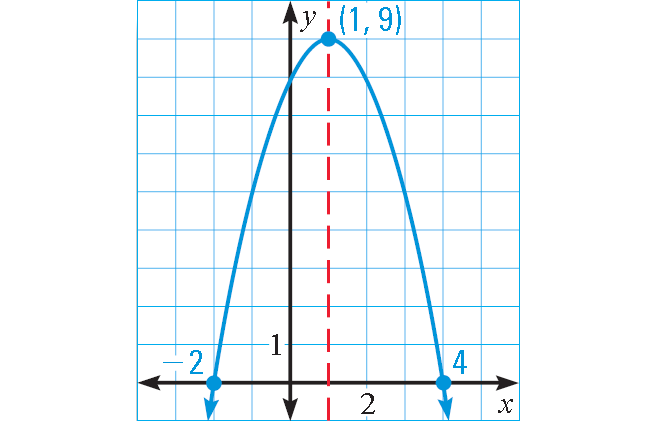
Graph : y = -(x + 2)(x - 4)
Solution :
The quadratic function is in intercept form
y = a(x - p)(x - q)
where a = -1, p = -2, and q = 4.
Because a < 0, the parabola opens down.
The x-intercepts occur at (-2, 0) and (4, 0).
The axis of symmetry lies halfway between these points, at x = 1.
So, the x-coordinate of the vertex is x = 1 and the y-coordinate of the vertex is :
y = -(1 + 2)(1 - 4)
= -(3)(-3)
= 9
The graph of the function is shown below.
Example 4 :
Write the quadratic function in intercept form

Solution :
By observing the graph, the x-intercepts are 1 and 4.
y-intercept = -4
y = a(x - 1) (x - 4) ---(1)
To find the value of a, let us apply the y-intercept. Applying the point (0, -4), we get
-4 = a(0 - 1)(0 - 4)
-4 = a(-1) (-4)
-4 = 4a
a = -1
Applying the value of a in (1), we get
y = -1(x - 1) (x - 4)
Example 5 :
Write the quadratic function in vertex form

Solution :
By observing the graph, the vertex of the parabola is (1, 1)
y-intercept = 0
Quadratic function in vertex form :
y = a(x - h)2 + k
Applying the vertex, we get
y = a(x - 1)2 + 1 ----(1)
Applying (0, 0), we get
0 = a(0 - 1)2 + 1
a(1) = -1
a = -1
By applying the value of a in (1), we get
y = -1(x - 1)2 + 1
Kindly mail your feedback to v4formath@gmail.com
We always appreciate your feedback.
©All rights reserved. onlinemath4all.com
Recent Articles
-
Digital SAT Math Problems and Solutions (Part - 146)
Apr 18, 25 06:52 AM
 Digital SAT Math Problems and Solutions (Part - 146)
 -
Logarithmic Derivative Problems and Solutions
Apr 16, 25 09:25 PM
Logarithmic Derivative Problems and Solutions -
Digital SAT Math Problems and Solutions (Part - 145)
Apr 16, 25 12:35 PM
 Digital SAT Math Problems and Solutions (Part - 145)