GRAPHING RELATIONSHIPS
Graphs can be used to illustrate many different situations. For example, trends shown on a cardiograph can help a doctor see how the patient’s heart is functioning.
To relate a graph to a given situation, use key words in the description.
Relating Graphs to Situations
Example 1 :
The air temperature was constant for several hours at the beginning of the day and then rose steadily for several hours. It stayed the same temperature for most of the day before dropping sharply at sundown. Choose the graph that best represents this situation.

Solution :
Step 1 :
Read the graphs from left to right to show time passing.
Step 2 :
List key words in order and decide which graph shows them.
Key Words
Segment Description
Graphs
Was constant
Horizontal
Graphs A and B
Rose steadily
Slanting upward
Graphs A and B
Stayed the same
Horizontal
Graph B
Dropped sharply
Slanting downward
Graph B
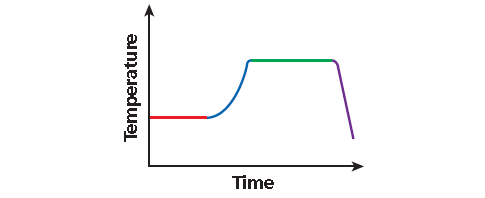
The correct graph is B.
Continuous and Discrete Graphs
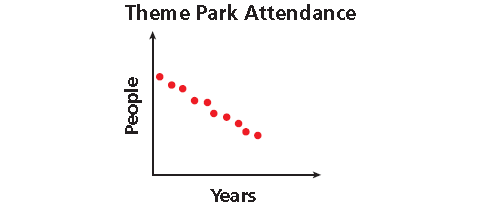
As seen in Example 1, some graphs are connected lines or curves called continuous graphs. Some graphs are only distinct points. These are called discrete graphs.
Sketching Graphs for Situations
Sketch a graph for each situation. Tell whether the graph is continuous or discrete.
Example 2 :
David is selling candles to raise money for the school dance. For each candle he sells, the school will get $2.50. He has 10 candles that he can sell.
Solution :
The amount earned (y-axis) increases by $2.50 for each candle Simon sells (x-axis).
Because David can only sell whole numbers of candles, the graph is 11 distinct points.
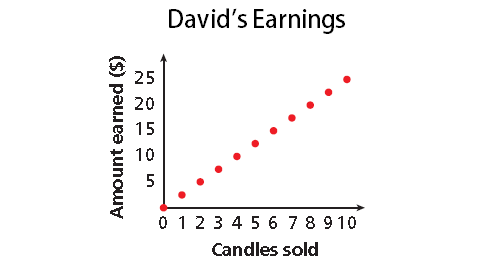
The graph is discrete.
Example 3 :
Monica’s heart rate is being monitored while she exercises on a treadmill. While walking, her heart rate remains the same. As she increases her pace, her heart rate rises at a steady rate. When she begins to run, her heart rate increases more rapidly and then remains high while she runs. As she decreases her pace, her heart rate slows down and returns to her normal rate.
Solution :
As time passes during her workout (moving left to right along the x-axis), her heart rate ( y-axis) does the following :
• remains the same,
• rises at a steady rate,
• increases more rapidly (steeper than previous segment),
• remains high,
• slows down,
• and then returns to her normal rate.
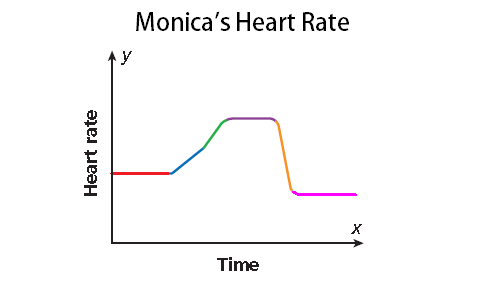
The graph is continuous.
Problem 4 :
Choose the graph that best represents each situation.

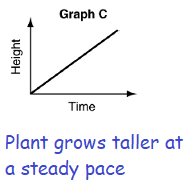
a) A tomato plant grows taller at a steady pace.
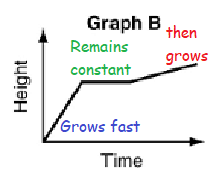
b) A tomato plant grows quickly at first, remains a constant height during a dry spell, then grows at a steady pace.
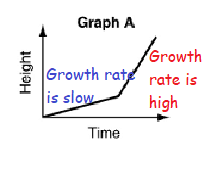
c) A tomato plant grows at a slow pace, then grows rapidly with more sun and water.
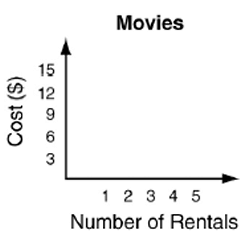
d) Lora has $15 to spend on move rentals for a week. Each rental cost $3. Sketch a graph to show how much money she might spend on movies in a week. Tell whether the graph is continuous or discrete.
Solution :
a) Graph c
b) graph B
c) Graph A
d) Let x be the number of movies she is renting.
Rental cost for each = $3
Let C be the cost.
Creating relationship between these variables C and x, we get
C = 3x
|
Number of movies she is renting x 0 1 2 3 4 5 |
Cost C = 3x 0 3 6 9 12 15 |
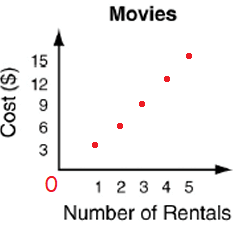
Number of movies will not be fraction or decimal, then the graph is discrete.
Problem 5 :
Choose the graph that best represents each situation.
a) A flag is raised up a flagpole quickly at the beginning and then more slowly near the top.
b) A flag is raised up a flagpole in jerky motion, using a hand over hand method
c) A flag is raised up a flagpole at the constant rate of speed.

Solution :
a) A flag is raised up a flagpole quickly at the beginning and then more slowly near the top.
Graph C
b) A flag is raised up a flagpole in jerky motion, using a hand over hand method
Graph A
c) A flag is raised up a flagpole at the constant rate of speed.
Graph B
Problem 6 :
Choose the graph that best represents each situation.

a) A person alternates between running and walking.
b) A person gradually speeds up at a constant running pace.
c) A person walks gradually speeds up to a run, then slows to walk.
Solution :
a) A person alternates between running and walking.
Graph B
b) A person gradually speeds up at a constant running pace.
Graph A
c) A person walks gradually speeds up to a run, then slows to walk.
Graph C
Problem 7 :
Sketch the graph of each situation. Tell whether the graph is continuous or discrete.
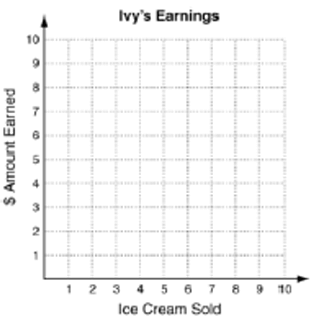
Ivy is selling ice cream. Each ice cream costs $1.50. She has 6 ice creams to sell.
Solution :
|
Number of ice creams (x) 1 2 3 4 5 6 |
Cost (C) = 1.5x 1.5 3 4.5 6 7.5 9 |
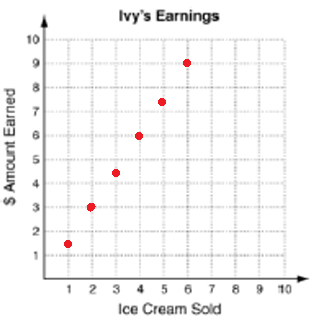
It is discrete.
Kindly mail your feedback to v4formath@gmail.com
We always appreciate your feedback.
©All rights reserved. onlinemath4all.com
Recent Articles
-
Digital SAT Math Problems and Solutions (Part - 134)
Apr 02, 25 12:40 AM
Digital SAT Math Problems and Solutions (Part - 134) -
SAT Math Resources (Videos, Concepts, Worksheets and More)
Apr 02, 25 12:35 AM
SAT Math Resources (Videos, Concepts, Worksheets and More) -
Digital SAT Math Problems and Solutions (Part 135)
Apr 02, 25 12:32 AM
Digital SAT Math Problems and Solutions (Part 135)
