HOW TO DETERMINE WHETHER THE GRAPH IS A FUNCTION
If we want to check whether the graph is a function or not we use the concept called vertical line test.
If the vertical line drawn across at anywhere of the graph intersects the graph at most once, we decide the given graph represents the function.
Example 1 :
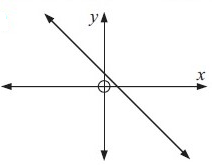
Solution :
Drawing a vertical lines across the graph, we get
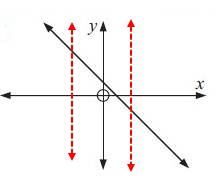
Each vertical lines are intersecting the graph at most once. So, the given graph represents the function.
Example 2 :
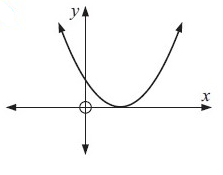
Solution :
Drawing a vertical lines across the graph, we get
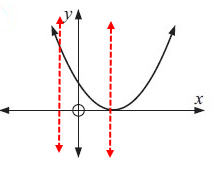
Each vertical lines are intersecting the graph at most once. So, the given graph represents the function.
Example 3 :
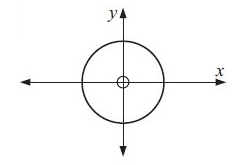
Solution :
Drawing a vertical lines across the graph, we get
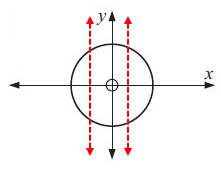
Each vertical line is intersecting the graph at more than one point. So, it is not a function.
Example 4 :
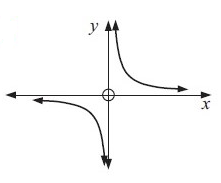
Solution :
Drawing a vertical lines across the graph, we get
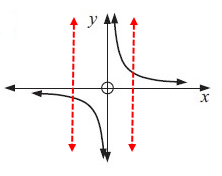
Every vertical line is intersecting the graph at most once. So, the given graph represents the function.
Example 5 :
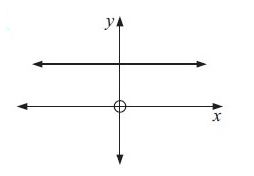
Solution :
Drawing a vertical lines across the graph, we get
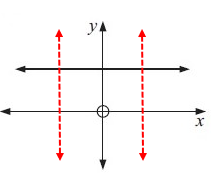
Each vertical line is intersecting the graph at most once. So, the given graph represents the function.
Example 6 :
Use the vertical line test to determine whether the following graph represents a function.
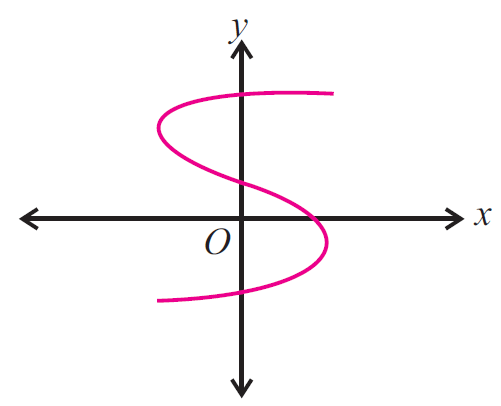
Solution :
Drawing a vertical lines across the graph, we get
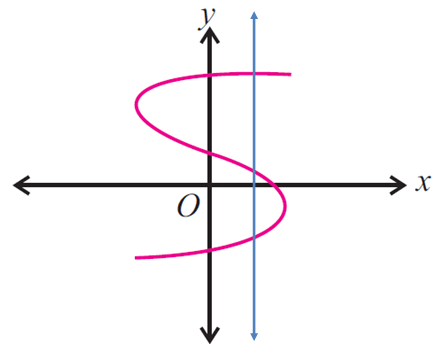
In the above graph, the vertical line intersects the graph in more than one point (three points), then the given graph does not represent a function.
Example 7 :
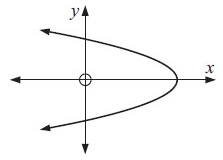
Solution :
Drawing a vertical lines across the graph, we get
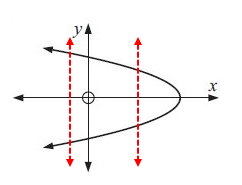
In the above graph, the vertical line intersects the graph in more than one point (two points), then the given graph does not represent a function.
Example 8 :
Rewrite the relation given in the scatter plot as a mapping diagram.
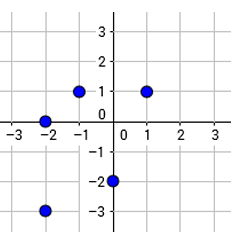
Is this relation also a function ?
Solution :
Points shown in the coordinate plane are
(1, 1) (-1, 1) (-2, 0) (0, -2) and (-2, -3)
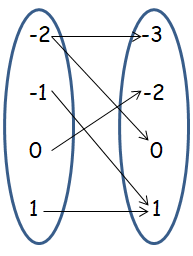
Here the input -2 is associated with more than one output. So, this relation is not a function.
Example 9 :
Rewrite the relation given in the scatter plot as a set of ordered pairs.
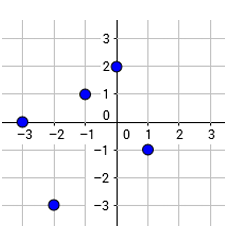
is this relation a function ?
Solution :
Writing the points from the coordinate plane.
(0, 2) (-1, 1) (1, -1) (-3, 0) (-2, -3)
Since each input is associated with different outputs, this relation is a function.
Example 10 :
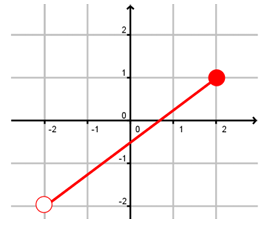
Determine if each graph shows a function or a relation only. Then identify the domain and range.
Solution :
By drawing the vertical line, it is intersecting the graph maximum once. So, this relation is a function.
By observing the graph horizontally, the possible inputs is domain.
Domain = -2 < x ≤ 2
By observing the graph vertically, the possible outputs is domain.
Range = -2 < x ≤ 1
Example 11 :
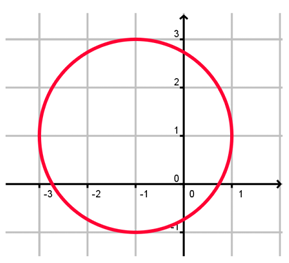
Solution :
By drawing the vertical line, it is not intersecting the graph maximum once. So, this relation is not a function.
By observing the graph horizontally, the possible inputs is domain.
Domain = -3 ≤ x ≤ 1
By observing the graph vertically, the possible outputs is domain.
Range = -1 ≤ x ≤ 3
Example 12 :
Identify the domain and range, then evaluate each function for the given value of x.
f = {(10, 7) (-2, 4) (5, 3) (4, 10)}
i) Domain ii) Range iii) f(5)
Solution :
f = {(10, 7) (-2, 4) (5, 3) (4, 10)}
i)
Possible inputs are domain.
Domain = {-2, 4, 5, 10}
ii)
Outputs are range.
Range = {3, 4, 7, 10}
iii) f(5) = 3
Example 13 :
Identify the domain and range, then evaluate each function for the given value of x.

i) Domain ii) Range iii) f(1)
Solution :
f = {(-3, 3) (-1, 1) (0, 0) (1, 1)}
i) Domain = {-3, -1, 0, 1}
ii) Range = {0, 1, 3}
iii) f(1) = 1
Example 14 :
Identify the domain and range, then evaluate each function for the given value of x.
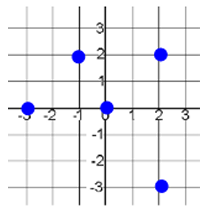
i) Domain ii) Range iii) f(-3)
Solution :
f = {(2, 2) (0, 0) (-1, 2) (-3, 0) (2, -3)}
i) Domain = {-3, -1, 0, 2}
ii) Range = {-3, 0, 2}
iii) f(-3) = 0
Example 15 :
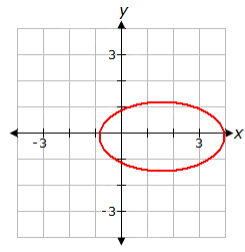
Using the vertical line test, determine if the graph above shows a relation, a function, both a relation and a function, or neither a relation nor a function.
A. neither a relation nor a function
B. relation only
C. both a relation and a function
D. function only
Solution :
The vertical line will intersect the graph more than one point. So, it is not a function. It is relation only. So, option B is correct.
Example 16 :
Which of the following relations describes a function?
A. { (0, 0), (0, 2), (2, 0), (2, 2) }
B. { (2, 2), (2, 3), (3, 2), (3, 3) }
C. { (2, -1), (2, 1), (3, -1), (3, 1) }
D. { (-2, -3), (-3, -2), (2, 3), (3, 2) }
Solution :
Option A :
{ (0, 0), (0, 2), (2, 0), (2, 2) }
The input 0 is having more than one output 0 and 2. So, it is not a function.
Option B :
{ (2, 2), (2, 3), (3, 2), (3, 3) }
The input 2 is having more than one output 2 and 3. So, it is not a function.
Option C :
{ (2, -1), (2, 1), (3, -1), (3, 1) }
The input 2 is having more than one output -1 and 1. So, it is not a function.
Option D :
{ (-2, -3), (-3, -2), (2, 3), (3, 2) }
Each input is having maximum one output. So, this relation represents a function.
Kindly mail your feedback to v4formath@gmail.com
We always appreciate your feedback.
©All rights reserved. onlinemath4all.com
Recent Articles
-
Digital SAT Math Problems and Solutions (Part - 134)
Apr 02, 25 12:40 AM
Digital SAT Math Problems and Solutions (Part - 134) -
SAT Math Resources (Videos, Concepts, Worksheets and More)
Apr 02, 25 12:35 AM
SAT Math Resources (Videos, Concepts, Worksheets and More) -
Digital SAT Math Problems and Solutions (Part 135)
Apr 02, 25 12:32 AM
Digital SAT Math Problems and Solutions (Part 135)
