HOW TO GRAPH LINEAR EQUATIONS IN SLOPE INTERCEPT FORM
Linear equation in slope-intercept form :
y = mx + b
Here, m stands for slope and b stands for y-intercept.
We already know that the graph of any linear equation will be a straight line.
When we have a linear equation in slope-intercept form, we can sketch the graph (straight line) of the equation using the slope 'm' and y-intercept 'b'.
y-intercept :
y-intercept is nothing but the value at where the line intersects y-axis.
Slope :
Slope is sometimes referred to as "rise over run".
That is,
slope = rise/run
Because the fraction consists of the rise (the change in y, going up or down) divided by the run (the change in x, going from left to the right).
Rising/Falling/Horizontal/Vertical Line :
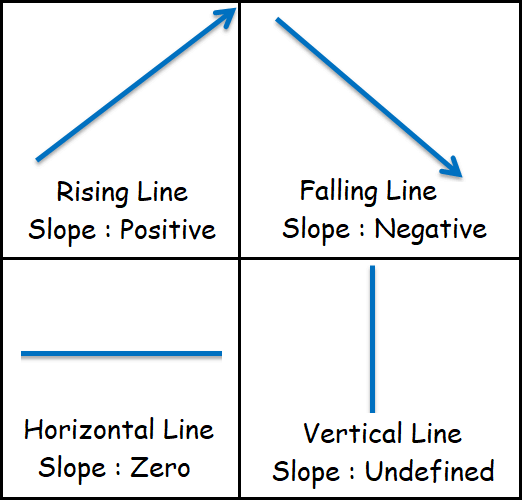
(i) If the slope of a line is positive, then the line will be going (from left to right) up and it is called rising line.
(ii) If the slope of a line is positive, then the line will be going (from left to right) down and it is called falling line.
(iii) If the slope is zero, the line will be horizontal.
(iv) If the slope is undefined, the line will be vertical.
Graph each of the following linear equations :
Example 1 :
y = (¼)x - 1
Solution :
The given linear equation is in slope-intercept form.
Comparing y = mx + b and y = (¼)x - 1,
slope m = ¼
y-intercept b = -1
Since slope (¼) is a positive value, the line is a rising line.
rise/run = ¼
rise = 1
run = 4
Since the y-intercept is -1, the line intersects y-axis at -1.
Graphing :
Step 1 :
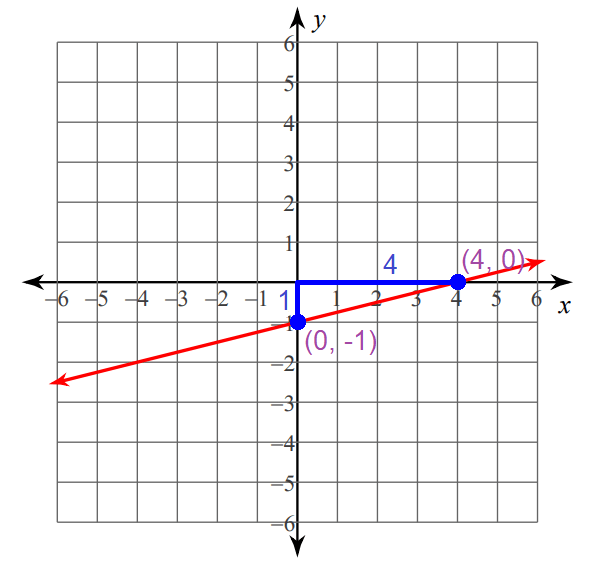
Plot the y-intercept at (0, -1).
Step 2 :
Since the rise (1) is a positive value, move 1 unit up from the y-intercept (0, -1).
Step 3 :
Since the run is 4, move 4 units to the right from the position reached in step 2.
Now, you are at (4, 0).
Connect the points (0, -1) and (4, 0) to get the line.
Example 2 :
y = -x + 2
Solution :
The given linear equation is in slope-intercept form.
Comparing y = mx + b and y = -x + 1,
slope m = -1
y-intercept b = 2
Since slope (-1) is a negative value, the line is a falling line.
rise/run = -1
rise/run = ⁻¹⁄₁
rise = -1
run = 1
Since the y-intercept is 2, the line intersects y-axis at 2.
Graphing :
Step 1 :
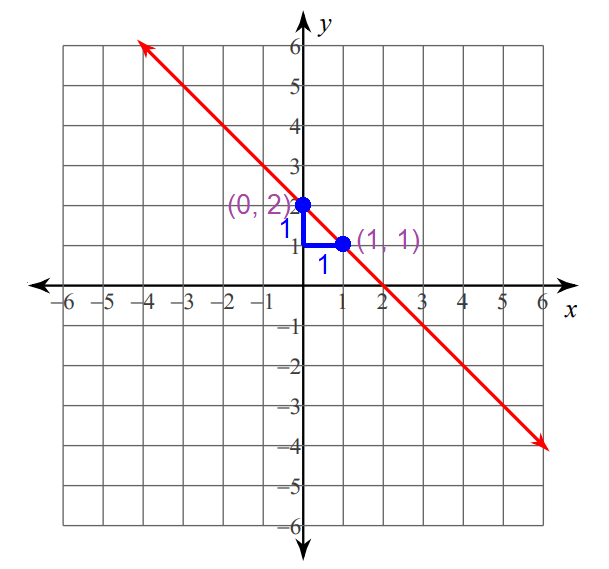
Plot the y-intercept at (0, 2).
Step 2 :
Since the rise (-1) is a negative value, move 1 unit dwon from the y-intercept (0, 2).
Step 3 :
Since the run is 1, move 1 unit to the right from the position reached in step 2.
Now, you are at (1, 1).
Connect the points (0, 2) and (1, 1) to get the line.
Example 3 :
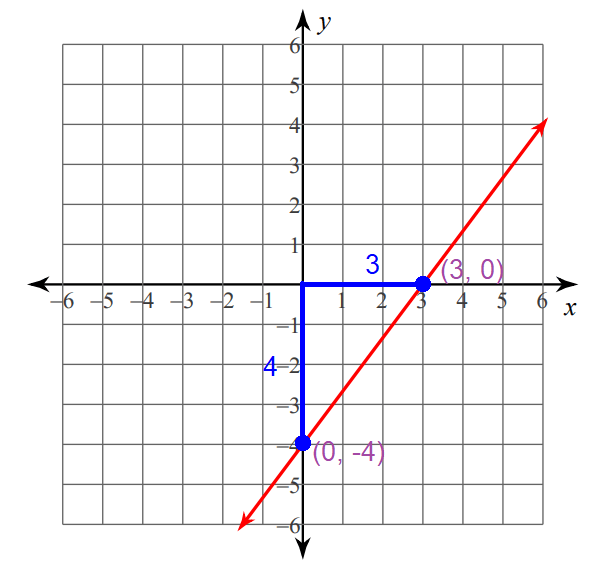
4x - 3y - 12 = 0
Solution :
The given linear equation is not in slope-intercept form.
Write it in slope-intercept form.
4x - 3y - 12 = 0
Subtract 4x from both sides.
-3y - 12 = -4x
Add 12 to both sides.
-3y = -4x + 12
Divide both sides by -3.
⁻³ʸ⁄₋₃ = ⁽⁻⁴ˣ ⁺ ¹²⁾⁄₋₃
y = ⁻⁴ˣ⁄₋₃ + ¹²⁄₋₃
y = ⁴ˣ⁄₃ - 4
y = (⁴⁄₃)x - 4
Comparing y = mx + b and y = (⁴⁄₃)x - 4,
slope m = ⁴⁄₃
y-intercept b = -4
Since slope (⁴⁄₃) is a positive value, the line is a rising line.
rise/run = ⁴⁄₃
rise = 4
run = 3
Since the y-intercept is -4, the line intersects y-axis at -4.
Graphing :
Step 1 :
Plot the y-intercept at (0, -4).
Step 2 :
Since the rise (4) is a positive value, move 4 units up from the y-intercept (0, -4).
Step 3 :
Since the run is 3, move 3 units to the right from the position reached in step 2.
Now, you are at (3, 0).
Connect the points (0, -4) and (3, 0) to get the line.
Example 4 :
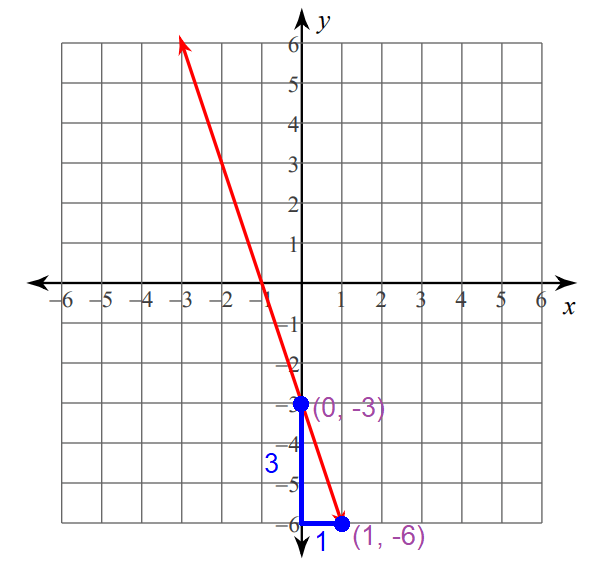
3x + y + 3 = 0
Solution :
The given linear equation is not in slope-intercept form.
Write it in slope-intercept form.
3x + y = -3
Subtract 3x from each side.
y = -3x - 3
Comparing y = mx + b and y = -3x - 3,
slope m = -3
y-intercept b = -3
Since slope (-3) is a negative value, the line is a falling line.
rise/run = -3
rise/run = ⁻³⁄₁
rise = -3
run = 1
Since the y-intercept is -3, the line intersects y-axis at -3.
Graphing :
Step 1 :
Plot the y-intercept at (0, -3).
Step 2 :
Since the rise (-3) is a negatuve value, move 3 units down from the y-intercept (0, -3).
Step 3 :
Since the run is 1, move 1 unit to the right from the position reached in step 2.
Now, you are at (1, -6).
Connect the points (0, -3) and (1, -6) to get the line.
Example 5 :
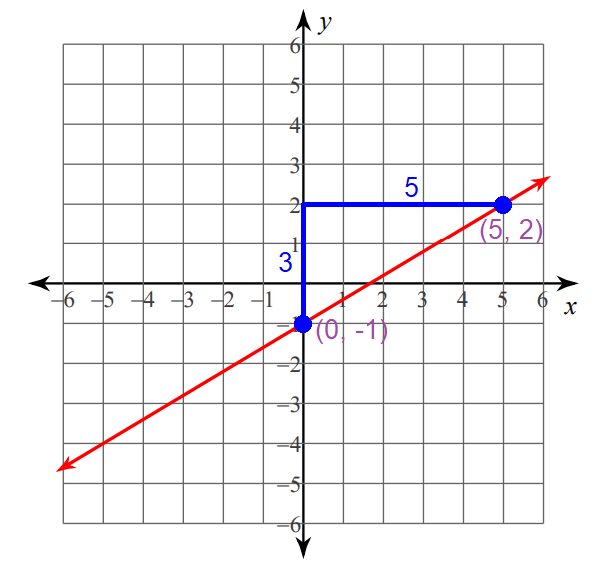
3x - 5y = 5
Solution :
The given linear equation is not in slope-intercept form.
Write it in slope-intercept form.
3x - 5y = 5
Subtract 3x from each side.
-5y = -3x + 5
Divide both sides by -5.
⁻⁵ʸ⁄₋₅ = ⁽⁻³ˣ ⁺ ⁵⁾⁄₋₅
y = ⁻³ˣ⁄₋₅ + ⁵⁄₋₅
y = ³ˣ⁄₅ - 1
y = (³⁄₅)x - 1
Comparing y = mx + b and y = (³⁄₅)x - 1,
slope m = ³⁄₅
y-intercept b = -1
Since slope (³⁄₅) is a positive value, the line is a rising line.
rise/run = ³⁄₅
rise = 3
run = 5
Since the y-intercept is -1, the line intersects y-axis at -1.
Graphing :
Step 1 :
Plot the y-intercept at (0, -1).
Step 2 :
Since the rise (3) is a positive value, move 3 units up from the y-intercept (0, -1).
Step 3 :
Since the run is 5, move 5 units to the right from the position reached in step 2.
Now, you are at (5, 2).
Connect the points (0, -1) and (5, 2) to get the line.
Example 6 :
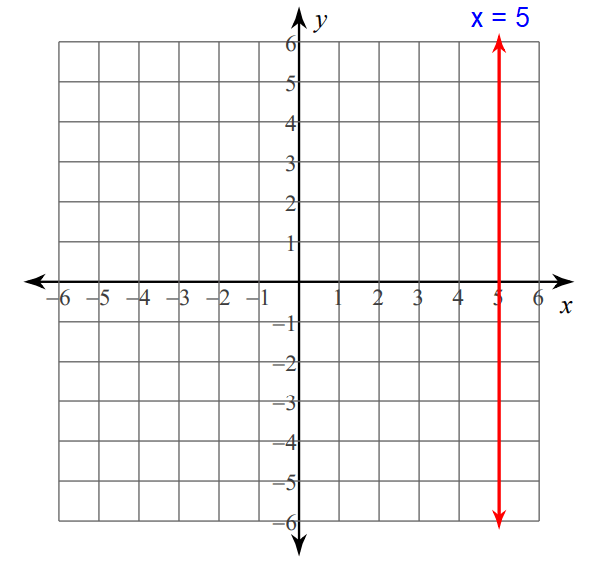
x = 5
Solution :
The graph of a linear equation in one variable will either be an horizontal line or a vertical line.
The given linear equation x = 5 contains only one variable x.
Since x = 5 contains the variable x, its graph is a vertical line through the value 5 on x-axis.
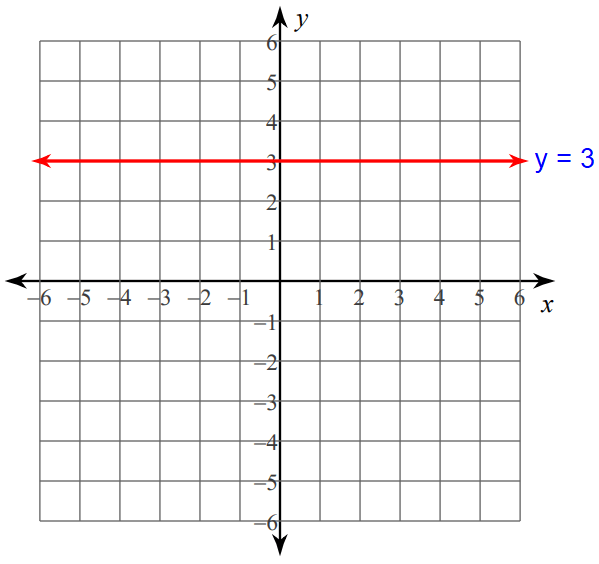
Example 7 :
y = 3
Solution :
The given linear equation y = 3 contains only one variable y.
Since y = 3 contains the variable y, its graph is an horizontal line through the value 3 on y-axis.
Kindly mail your feedback to v4formath@gmail.com
We always appreciate your feedback.
©All rights reserved. onlinemath4all.com
Recent Articles
-
Digital SAT Math Problems and Solutions (Part - 144)
Apr 14, 25 07:27 PM
Digital SAT Math Problems and Solutions (Part - 144) -
Quadratic Equation Problems with Solutions (Part - 1)
Apr 14, 25 11:33 AM
Quadratic Equation Problems with Solutions (Part - 1) -
Quadratic Equation Problems with Solutions (Part - 2)
Apr 14, 25 11:22 AM
Quadratic Equation Problems with Solutions (Part - 2)
