HOW TO SKETCH THE CURVE OF A FUNCTION
When we are sketching the graph of functions either by hand or through any graphing software we cannot show the entire graph. Only a part of the graph can be sketched.
A crucial question is which part of the curve we need to show and how to decide that part. To decide on this we use the derivatives of functions. We enlist few guidelines for determining a good viewing rectangle for the graph of a function. They are :
(i) The domain and the range of the function.
(ii) The intercepts of the cure (if any).
(iii) Critical points of the function.
(iv) Local extrema of the function.
(v) Intervals of concavity.
(vi) Points of inflections (if any).
(vii) Asymptotes of the curve (if exists)
Sketch the graphs of the following functions.
Problem 1 :
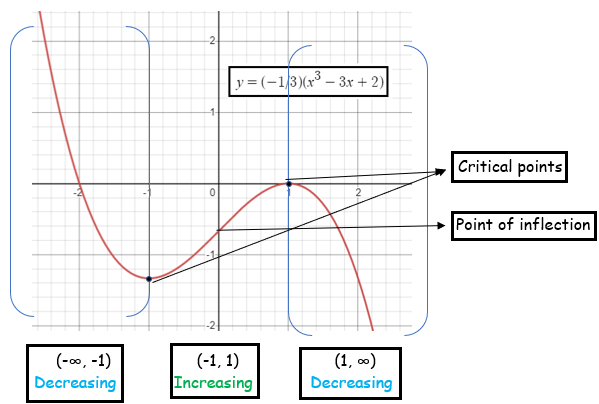
y = (-1/3)(x3-3x+2)
Solution :
Domain and range :
Since it is a polynomial function, all real values are domain and range.
Intercepts :
To find x intercept, put y = 0
x3-3x+2 = 0
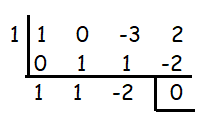
Factors are = (x-1) (x2+x-2)
= (x-1) (x+ 2)(x-1)
Equating each to zero, we get x = 1, -2 and 1.
So, 1 and -2 are x-intercepts.
Y-intercept :
x = 0
y = -2/3
Critical points :
f(x) = (-1/3)(x3-3x+2)
f'(x) = (-1/3) (3x2-3)
f'(x) = -1(x2-1)
f'(x) = -1(x+1)(x-1)
f'(x) = 0
-1(x+1)(x-1) = 0
x = -1, 1
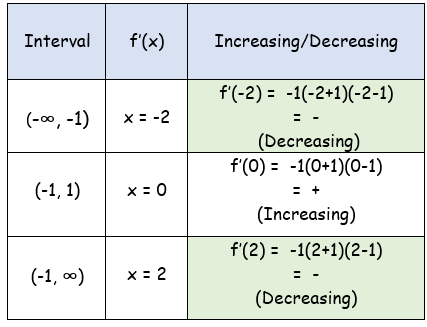
Plotting these points on the number line and dividing into intervals, we get (-∞, -1), (-1, 1) and (1, ∞).
Local extrema :
f'(x) = -1(x2-1)
f''(x) = -2x
f''(-1) = 2 > 0 (Minimum)
f''(1) = -2 < 0 (Maximum)
Maximum value at x = 1 :
y = (-1/3)(13-3(1)x+2)
y = (-1/3)(1-3+2)
y = 0
Minimum value at x = -1 :
y = (-1/3)(-13-3(-1)+2)
y = (-1/3)(-1+3+2)
y = 4/3
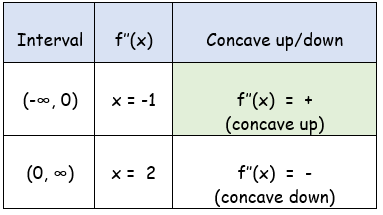
Intervals of concavity :
f''(x) = -2x
f''(x) = 0
2x = 0
x = 0
Dividing this into intervals, we get
(-∞, 0) and (0, ∞)
Point of inflection :
At x = 0
y = (-1/3)(03-3(0)+2)
y = -2/3
So, point of inflection is (0, -2/3).
Asymptotes :
It will have only slant asymptote.
For each problem, find the: x and y intercepts, x-coordinates of the critical points, open intervals where the function is increasing and decreasing, x-coordinates of the inflection points, open intervals where the function is concave up and concave down, and relative minima and maxima. Using this information, sketch the graph of the function.
Problem 2 :
f(x) = -x3/3 + x2
Solution :
f(x) = -x3/3 + x2
Finding critical numbers :
f'(x) = -3x2/3 + 2x
f'(x) = -x2 + 2x
f'(x) = 0
-x2 + 2x = 0
-x(x - 2) = 0
x = 0 and x = 2
Critical numbers are 0 and 2.
Finding increasing and decreasing interval :
(-∞, 0) (0, 2) and (2, ∞)
|
Intervals |
-x(x - 2) |
Increasing/decreasing |
|
(-∞, 0) |
x = -3 3(-3 - 2) - < 0 |
Decreasing on (-∞, 0) |
|
(0, 2) |
x = 1 -1(-1 - 2) + > 0 |
increasing on (0, 2) |
|
(2, ∞) |
x = 3 -3(3 - 2) - < 0 |
Decreasing on (2, ∞) |
Finding concavity on the intervals :
f'(x) = -x2 + 2x
f''(x) = -2x + 2
f''(x) = 0
-2x + 2 = 0
-2x = -2
x = 1
(-∞, 1) and (1, ∞)
|
Intervals |
f''(x) = -2(x - 1) |
Concave up/down |
|
(-∞, 1) |
x = 0 f''(0) = -2(0 - 1) = 2 |
Concave up on (-∞, 1) |
|
(1, ∞) |
x = 2 f''(2) = -2(2 - 1) = -2 < 0 |
Concave down on (1, ∞) |
Point of inflection :
When x = 1 f''(x) = -2(1) + 2
+-13/3 + 1
f''(x) = 0
-2x = -2
x = 1
Point of inflection at x = 1
Finding maximum/minimum :
Critical numbers should be applied in the second derivative
When x = 0
f''(0) = -2(0) + 2
= 0 (there is no max/min at x = 0)
When x = 2
f''(2) = -2(2) + 2
= -2 < 0 (maximum at x = 2)
When x = 2 in f(x)
f(2) = -23/3 + 22
= -8/3 + 4
= 4/3
So, maximum at (2, 4/3).

Problem 3 :
Sketch the graph of the function f(x) that satisfies f'(x) > 0 for x < -2 and x > 3 and f'(x) < 0 for -2 < x < 3
Solution :
|
Interval f'(x) f(x) |
x < -2 + increasing |
-2 < x < 3 - decreasing |
x > 3 + increasing |
- At x = -2, f'(x) changes from positive to negative there is local maximum.
- At x = 3, f'(x) changes from negative to positive there is local minimum.

Problem 4 :
Sketch the graph of f(x), assuming f(0) = 1 and given the graph of the derivative f'(x).

Solution :
x-intercepts are -2 and 0. Critical numbers are -2 and 0.
|
Interval f'(x) f(x) |
x < -2 - decreasing |
-2 < x < 0 + increasing |
x > 0 - decreasing |
- At x = -2, slope changes from negative to positive. Then there is local minimum at x = -2.
- At x = 0, slope change from positive to negative. Then there is local maximum at x = 0.

Kindly mail your feedback to v4formath@gmail.com
We always appreciate your feedback.
©All rights reserved. onlinemath4all.com
Recent Articles
-
Digital SAT Math Problems and Solutions (Part - 146)
Apr 18, 25 06:52 AM
 Digital SAT Math Problems and Solutions (Part - 146)
 -
Logarithmic Derivative Problems and Solutions
Apr 16, 25 09:25 PM
Logarithmic Derivative Problems and Solutions -
Digital SAT Math Problems and Solutions (Part - 145)
Apr 16, 25 12:35 PM
 Digital SAT Math Problems and Solutions (Part - 145)