IDENTIFYING PROPORTIONAL RELATIONSHIPS WORKSHEET
Problem 1 :
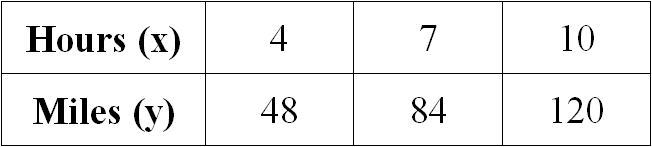
Examine the given table and determine if the relationship is proportional. If yes, determine the constant of proportionality.
Problem 2 :
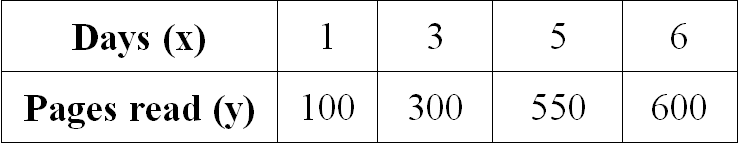
Examine the given table and determine if the relationship is proportional. If yes, determine the constant of proportionality.
Problem 3 :
The equation y = 5x represents the relationship between the number of gallons of water used (y) and the number of minutes (x) for most shower heads manufactured before 1994. Graph the above relationship and check whether it is proportional.
Problem 4 :
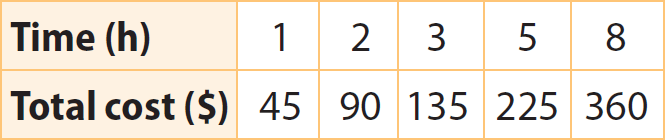
The table shows the relationship between the amount charged by a housecleaning company ($) and the amount of time worked (hours). Is the relationship a proportional relationship? Explain.
Problem 5 :
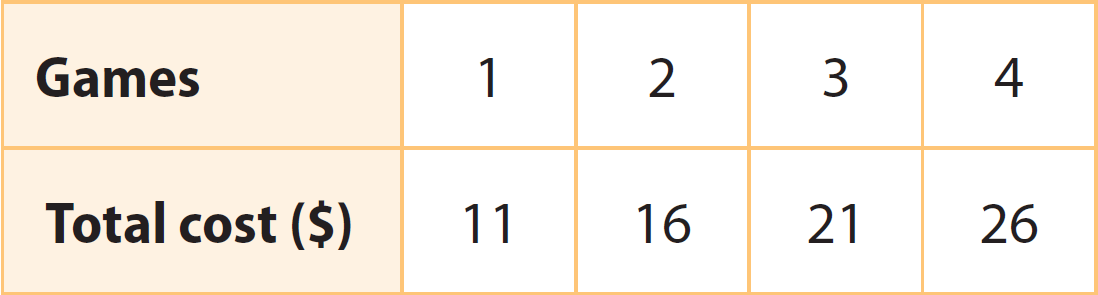
Jared rents bowling shoes for $6 and pays $5 per bowling game. Is the relationship a proportional relationship? Explain.

1. Answer :
Let us get the ratio of x and y for all the given values.
4/48 = 1/12
7/84 = 1/12
10/120 = 1/12
When we take ratio of x and y for all the given values, we get equal value for all the ratios.
Therefore the relationship given in the table is proportional.
When we look at the above table when x gets increased, y also gets increased, so it is direct proportion.
Then, we have
y = kx
Substitute x = 4 and y = 48.
48 = k(4)
12 = k
So, the constant of proportionality is 12.
2. Answer :
Let us get the ratio of x and y for all the given values.
1/100 = 1/100
3/300 = 1/100
5/550 = 1/110
6/600 = 1/100
When we take ratio of x and y for all the given values, we don't get equal value for all the ratios.
Therefore the relationship given in the table is not proportional.
3. Answer :
Step 1 :
To graph the given relationship, let us plug some random values for x in y = 5x as given in the table.
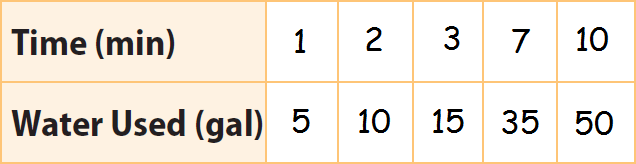
Step 2 :
Write the data in the table as ordered pairs (time, water used).
(1, 5), (2, 10), (3, 15), (7, 35) and (10, 50)
Step 3 :
Plot the ordered pairs and connect all the points.
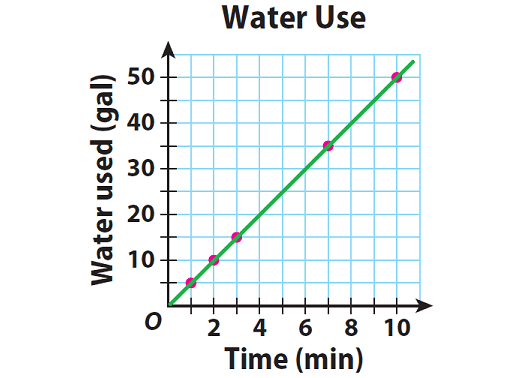
Step 4 :
Because the line drawn through the points goes through the origin, the relationship is proportional.
4. Answer :
Step 1 :
Write the data in the table as ordered pairs (time, water used).
(1, 45), (2, 90), (3, 135), (7, 225) and (8, 360)
Step 2 :
Plot the ordered pairs and connect all the points.
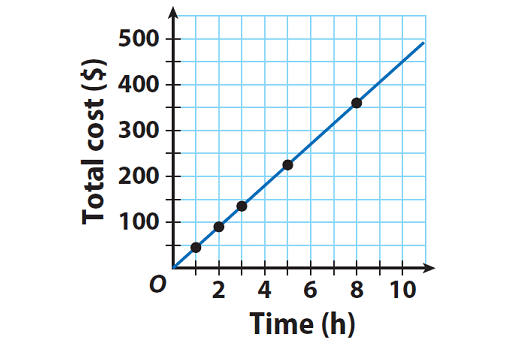
Step 3 :
Because the line drawn through the points goes through the origin, the relationship is proportional.
5. Answer :
Step 1 :
Write the data in the table as ordered pairs (time, water used).
(1, 11), (2, 16), (3, 21), and (4, 26)
Step 2 :
Plot the ordered pairs and connect all the points.
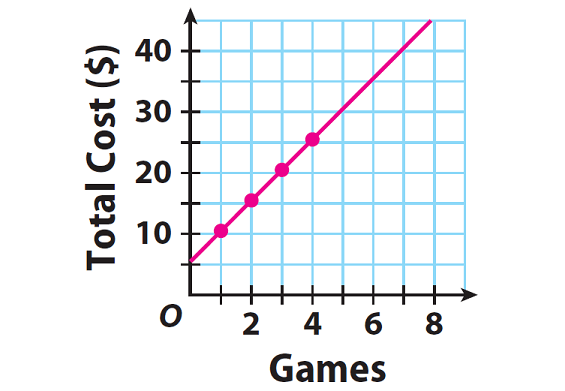
Step 3 :
Because the line drawn through the points does not go through the origin, the relationship is not proportional.
Kindly mail your feedback to v4formath@gmail.com
We always appreciate your feedback.
©All rights reserved. onlinemath4all.com
Recent Articles
-
Derivative of Absolute Value of x Using Limit Definition
Apr 23, 25 11:11 AM
Derivative of Absolute Value of x Using Limit Definition -
Digital SAT Math Problems and Solutions (Part - 149)
Apr 23, 25 02:33 AM
 Digital SAT Math Problems and Solutions (Part - 149)
 -
Digital SAT Math Problems and Solutions (Part - 148)
Apr 22, 25 08:20 AM
 Digital SAT Math Problems and Solutions (Part - 148)