INTERPRETING A DOT PLOT WORKSHEET
Problem 1 :
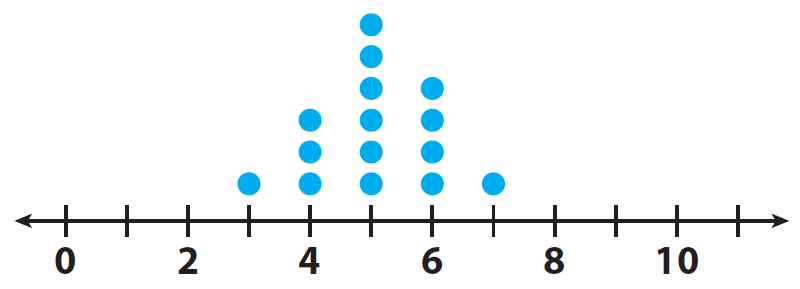
Describe the spread, center, and shape of the dot plot given below.
Problem 2 :
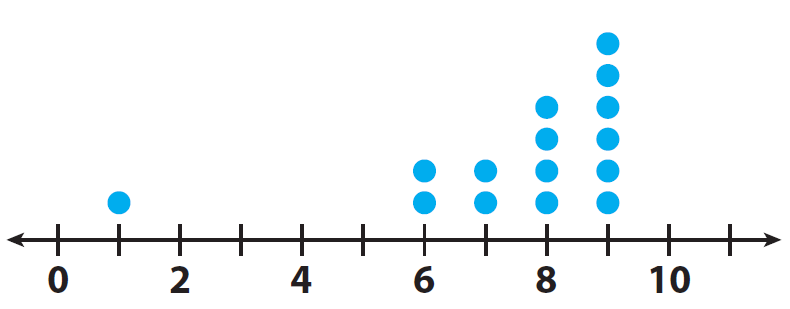
Describe the spread, center, and shape of the dot plot given below.
Problem 3 :
Describe the spread, center, and shape of the dot plot given below.
Problem 4 :
Describe the spread, center, and shape of the dot plot given below.

Detailed Answer Key
Problem 1 :
Describe the spread, center, and shape of the dot plot given below.

Solution :
The data values are spread out from 3 to 7 with no outliers.
The data has a cluster from 3 to 7 with one peak at 5, which is the center of the distribution.
The distribution is symmetric. The data values are clustered around the center of the distribution.
Problem 2 :
Describe the spread, center, and shape of the dot plot given below.

Solution :
The data values are spread out from 1 to 9. The data value 1 appears to be an out lier.
The data has a cluster from 6 to 9 with one peak at 9, which is the greatest value in the data set.
The distribution is not symmetric. The data values are clustered at one end of the distribution.
Problem 3 :
Describe the spread, center, and shape of the dot plot given below.

Solution :
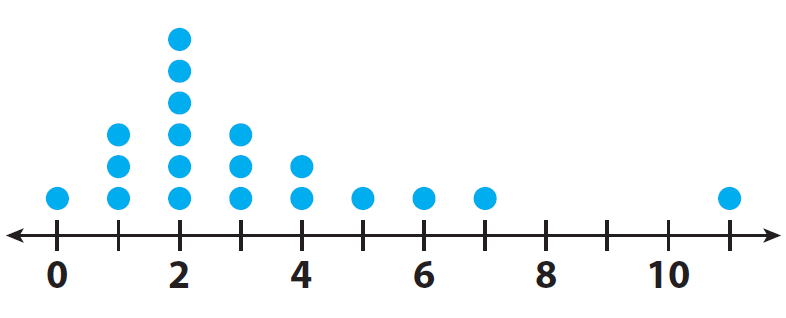
The data values are spread out from 0 to 11. The data value 11 appears to be an out lier.
The data has a cluster from 0 to 7 with one peak at 2, which is the greatest value in the data set.
The distribution is not symmetric. The data values are clustered at one end of the distribution.
Problem 4 :
Describe the spread, center, and shape of the dot plot given below.
Solution :

Solution :
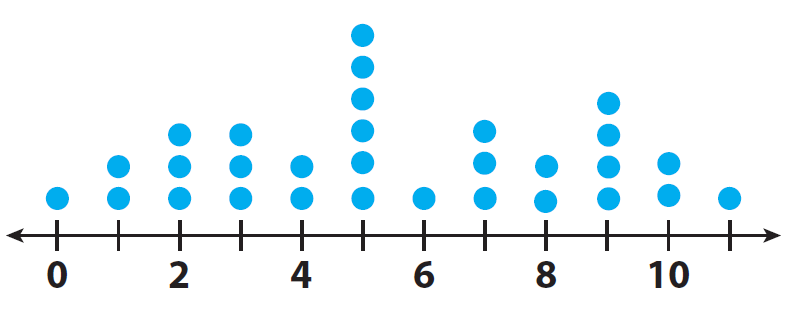
The data values are spread out from 0 to 11 with no outliers.
The data has a cluster from 0 to 11 with one peak at 5, which is the center of the distribution.
The distribution is symmetric. The data values are clustered around the center of the distribution.
Kindly mail your feedback to v4formath@gmail.com
We always appreciate your feedback.
©All rights reserved. onlinemath4all.com
Recent Articles
-
Digital SAT Math Problems and Solutions (Part - 143)
Apr 13, 25 12:01 PM
Digital SAT Math Problems and Solutions (Part - 143) -
Quadratic Equation Problems with Solutions
Apr 12, 25 08:21 PM
Quadratic Equation Problems with Solutions -
Digital SAT Math Problems and Solutions (Part - 142)
Apr 11, 25 06:26 PM
Digital SAT Math Problems and Solutions (Part - 142)
