KARL PEARSON PRODUCT MOMENT CORRELATION COEFFICIENT
This is by for the best method for finding correlation between two variables provided the relationship between the two variables is linear.
Pearson’s correlation coefficient may be defined as the ratio of covariance between the two variables to the product of the standard deviations of the two variables.
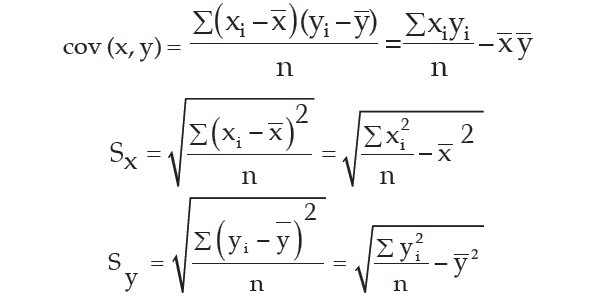
If the two variables are denoted by x and y and if the corresponding bivariate data are (xᵢ, yᵢ) for i = 1, 2, 3, ….., n, then the coefficient of correlation between x and y, due to Karl Pearson, in given by :

where

A single formula for computing correlation coefficient is given by

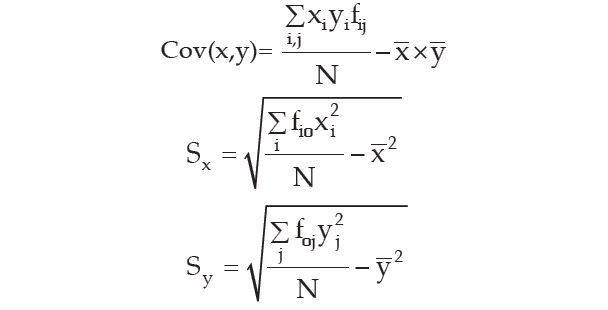
In case of a grouped frequency distribution, we have

where
xi = mid-value of the ith class interval of x
yi = mid-value of the jth class interval of y
fio = marginal frequency of x
foj = marginal frequency of y
fij = frequency of the (i, j)th cell
N = ∑i,jfij = ∑ifio = ∑jfoj = total frequency
Properties of Pearson Correlation Coefficient
(i) The Coefficient of Correlation is a unit-free measure.
This means that if x denotes height of a group of students expressed in cm and y denotes their weight expressed in kg, then the correlation coefficient between height and weight would be free from any unit.
(ii) The coefficient of correlation remains invariant under a change of origin and/or scale of the variables under consideration depending on the sign of scale factors.
This property states that if the original pair of variables x and y is changed to a new pair of variables u and v by effecting a change of origin and scale for both x and y i.e.
u = (x - a)/b and v = (y - c)/d
where a and c are the origins of x and y and b and d are the respective scales and then we have

rxy and ruv being the coefficient of correlation between x and y and u and v respectively, From the result given in the above picture, numerically, the two correlation coefficients remain equal and they would have opposite signs only when b and d, the two scales, differ in sign.
(iii) The coefficient of correlation always lies between –1 and 1, including both the limiting values i.e.
That is,
-1 ≤ r ≤ 1
Problem :
Compute the correlation coefficient between x and y from the following data.
n = 10, ∑xy = 220, ∑x2 = 200, ∑y2 = 262, ∑x = 40, ∑y = 50
Solution :
The formula to find Pearson correlation coefficient is given by

Cov (x, y) = [∑xy/n] - mean of x . mean of y
Mean of x = ∑x/n = 40/10 = 4.
Mean of y = ∑y/n = 50/10 = 5.
Cov (x, y) = [220/10] - 4 x 5
= 22 - 20
= 2
SD of x = square root of [(∑x2/n) - (mean of x)2]
= square root of [(200/10) - (4)2]
= square root of [20 - 16]
= square root of [4]
= 2
SD of y = square root of [(∑y2/n) - (mean of y)2]
= square root of [(262/10) - (5)2]
= square root of [26.2 - 25]
= square root of [1.2]
= 1.0954
Pearson correlation coefficient :
r = 2/(2 x 1.0954)
= 2/2.1908
= 0.91
Thus there is a good amount of positive correlation between the two variables x and y.
Kindly mail your feedback to v4formath@gmail.com
We always appreciate your feedback.
©All rights reserved. onlinemath4all.com
Recent Articles
-
Digital SAT Math Problems and Solutions (Part - 146)
Apr 18, 25 06:52 AM
Digital SAT Math Problems and Solutions (Part - 146) -
Logarithmic Derivative Problems and Solutions
Apr 16, 25 09:25 PM
Logarithmic Derivative Problems and Solutions -
Digital SAT Math Problems and Solutions (Part - 145)
Apr 16, 25 12:35 PM
Digital SAT Math Problems and Solutions (Part - 145)

