LEADING COEFFICIENT TEST
Whether the graph of a polynomial rises or falls can be determined by the Leading Coefficient Tests.
P(x) = anxn + an-1xn-1 +............. a1x + a0
In the above polynomial, n is the degree and an is the leading coefficient.
|
Case |
End Behavior of Graph |
When n is odd and an is positive
Graph falls to the left and rises to the right
When n is odd and an is negative
Graph rises to the left and falls to the right
When n is even and an is positive
Graph rises to the left and right
When n is even and an is negative
Graph falls to the left and right
Example 1 :
Find the right-hand and left-hand behaviors of the graph of
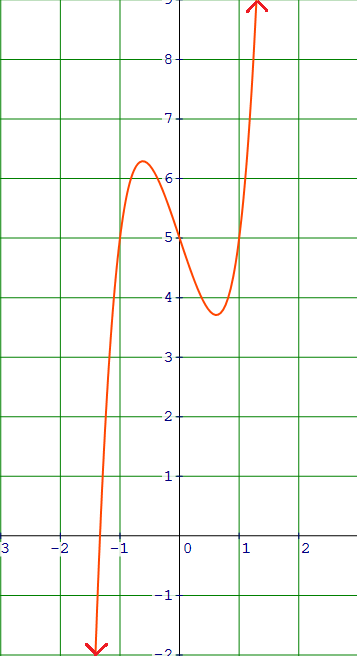
f(x) = x5 + 2x3 - 3x + 5
Solution :
Because the degree is odd and the leading coefficient is positive, the graph falls to the left and rises to the right as shown in the figure.
Example 2 :
Determine the end behavior of the graph of the polynomial function below using Leading Coefficient Test.
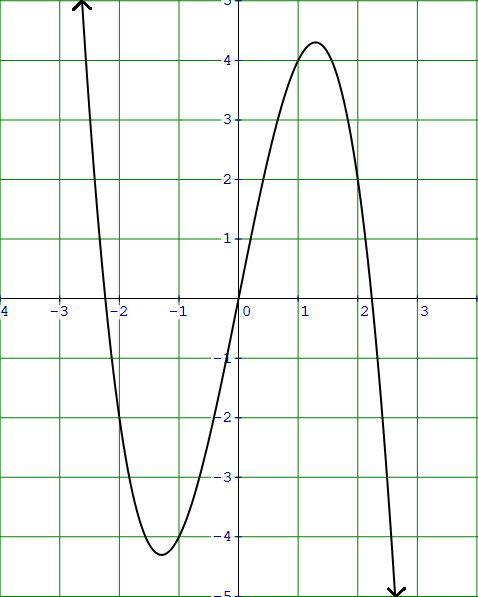
P(x) = -x3 + 5x
Solution :
Because the degree is odd and the leading coefficient is negative, the graph rises to the left and falls to the right as shown in the figure.
Example 3 :
Determine the end behavior of the graph of the polynomial function below using Leading Coefficient Test.
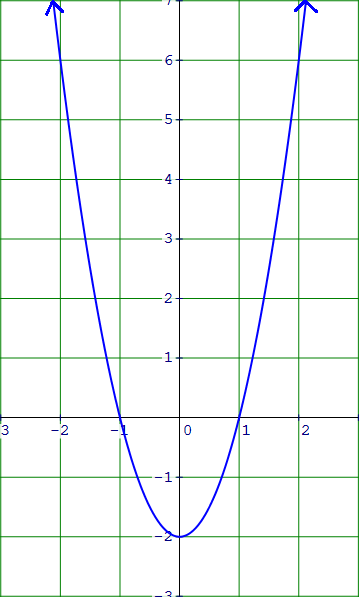
P(x) = 2x2 - 2
Solution :
Because the degree is even and the leading coefficient is positive, the graph rises to the left and right as shown in the figure.
Example 4 :
Determine the end behavior of the graph of the polynomial function below using Leading Coefficient Test.
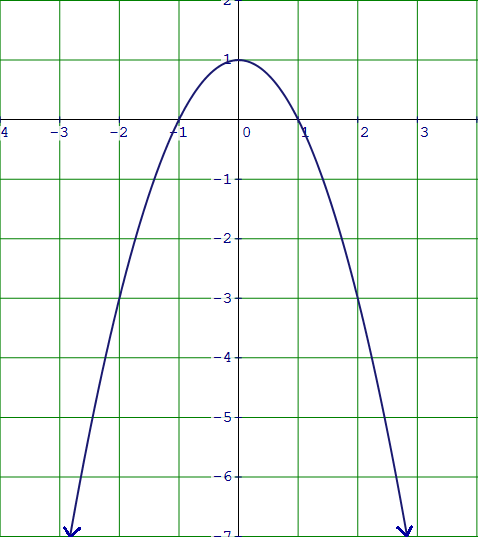
P(x) = -x2 + 1
Solution :
Because the degree is even and the leading coefficient is negative, the graph falls to the left and right as shown in the figure.
Kindly mail your feedback to v4formath@gmail.com
We always appreciate your feedback.
©All rights reserved. onlinemath4all.com
Recent Articles
-
Digital SAT Math Problems and Solutions (Part - 146)
Apr 18, 25 06:52 AM
Digital SAT Math Problems and Solutions (Part - 146) -
Logarithmic Derivative Problems and Solutions
Apr 16, 25 09:25 PM
Logarithmic Derivative Problems and Solutions -
Digital SAT Math Problems and Solutions (Part - 145)
Apr 16, 25 12:35 PM
Digital SAT Math Problems and Solutions (Part - 145)
