LINEAR INEQUALITIES
A linear inequality is similar to a linear equation, but the equal sign is replaced with an inequality symbol.
A solution of a linear inequality is any ordered pair that makes the inequality true.
Identifying Solutions of Inequalities
Tell whether the ordered pair is a solution of the inequality.
Example 1 :
(7, 3) ; y < x - 1
Solution :
Substitute 7 for x and 3 for y in the given inequality.
3 < 7 - 1
3 < 4 ✓
(7, 3) is a solution.
Example 2 :
(4, 5) ; y > 3x + 2
Solution :
Substitute 4 for x and 5 for y in the given inequality.
5 > 3(4) + 2
5 > 12 + 2
5 > 14 ✗
(4, 5) is not a solution.
Graphical Solution of Linear Inequalities
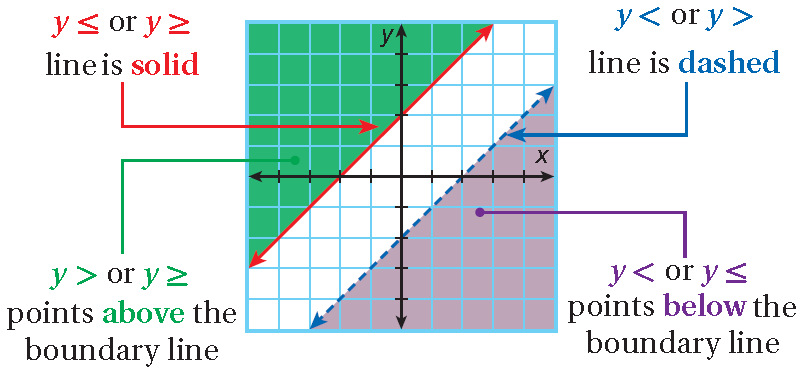
A linear inequality describes a region of a coordinate plane called a half-plane. All points in the region are solutions of the linear inequality. The boundary line of the region is the graph of the related equation.
1. When the inequality is written as y ≤ or y ≥, the points on the boundary line are solutions of the inequality, and the line is solid.
2. When the inequality is written as y > or y ≥, the points above the boundary line are solutions of the inequality.
3. When the inequality is written as y < or y >, the points on the boundary line are not solutions of the inequality, and the line is dashed.
4. When the inequality is written as y < or y ≤, the points below the boundary line are solutions of the inequality.
Graphing Linear Inequalities in Two Variables
Step 1 :
Solve the inequality for y.
Step 2 :
Graph the boundary line. Use a solid line for ≤ or ≥. Use a dashed line for < or >.
Step 3 :
Shade the half-plane above the line for y > or y ≥. Shade the half-plane below the line for y < or y ≤. Check your answer.
Graph the solutions of each linear inequality.
Example 3 :
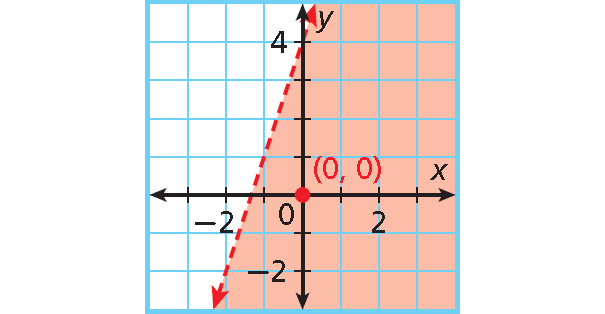
y < 3x + 4
Solution :
Step 1 :
The inequality is already solved for y.
Step 2 :
Graph the boundary line y = 3x + 4. Use a dashed line for <.
Step 3 :
The inequality is <, so shade below the line.
Example 4 :
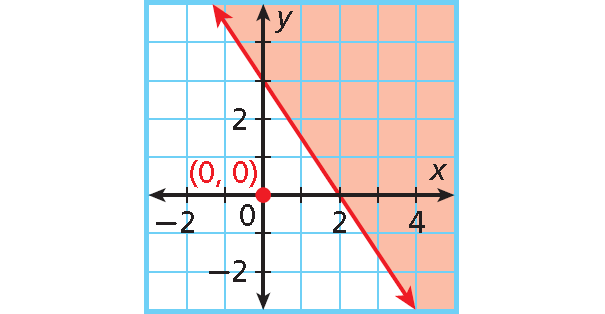
3x + 2y ≥ 6
Solution :
Step 1 :
Solve the inequality for y.
3x + 2y ≥ 6
2y ≥ 6 - 3x
y ≥ 3 - (3/2)x
y ≥ -(3/2)x + 3
Step 2 :
Graph the boundary line y = -(3/2)x + 3. Use a solid line for ≥.
Step 3 :
The inequality is ≥, so shade above the line.
Writing an Inequality from a Graph
Write an inequality to represent each graph.
Example 5 :
Solution :
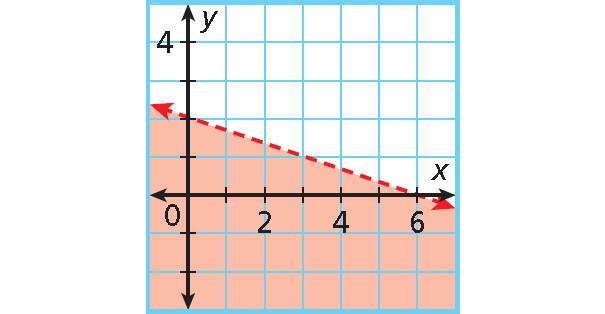
y-intercept : 2; slope : - 1/3.
Write an equation in slope-intercept form.
y = mx + b ---> y = -(1/3)x + 2
The graph is shaded below a dashed boundary line.
Replace = with < to write the inequality y < -(1/3)x + 2.
Example 6 :
Solution :
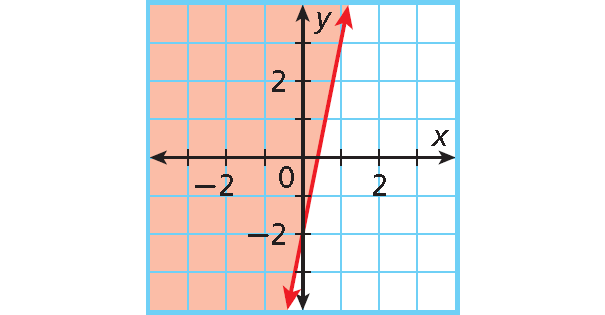
y-intercept : -2; slope : 5.
Write an equation in slope-intercept form.
y = mx + b ---> y = 5x + (-2)
The graph is shaded above a solid boundary line.
Replace = with ≥ to write the inequality y ≥ 5x - 2.
Example 7 :
Solution :
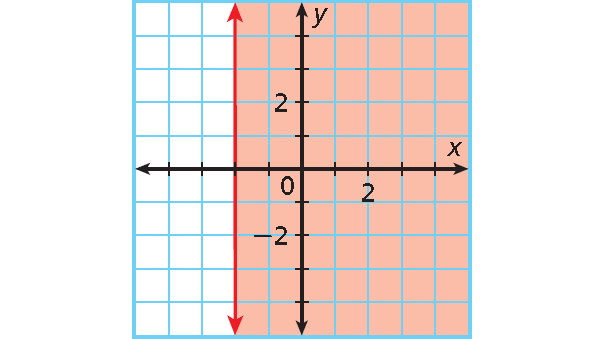
y-intercept : none; slope : undefined.
The graph is a vertical line at x = -2.
The graph is shaded on the right side of a solid boundary line.
Replace = with ≥ to write the inequality x ≥ - 2.
Consumer Economics Application
Example 8 :
Lily can spend at most $7.50 on vegetables for a party. Broccoli costs $1.25 per bunch and carrots cost $0.75 per package.
A. Write a linear inequality to describe the situation.
B. Graph the solutions.
C. Give two combinations of vegetables that Sarah can buy.
Solution :
A. Write a linear inequality to describe the situation.
Let x represent the number of bunches of broccoli and let y represent the number of packages of carrots.
Write an inequality. Use ≤ for “at most.”
Cost of broccoli plus cost of carrots is at most $7.50
1.25x + 0.75y ≤ $7.50
Solve the inequality for y.
1.25x + 0.75y ≤ 7.50
100(1.25x + 0.75y) ≤ 100(7.50)
125x + 75y ≤ 750
75y ≤ 750 - 125x
75y/75 ≤ 750/75 - 125x/75
y ≤ 10 - (5/3)x
y ≤ -(5/3)x + 10
B. Write a linear inequality to describe the situation.
Step 1 :
Because Lily cannot buy a negative amount of vegetables, the system is graphed only in Quadrant I. Graph the boundary line y = -(5/3)x + 10. Use a solid line for ≤.
Step 2 :
Shade below the line. Lily must buy whole numbers of bunches or packages. All points on or below the line with whole-number coordinates represent combinations of broccoli and carrots that Lily can buy.
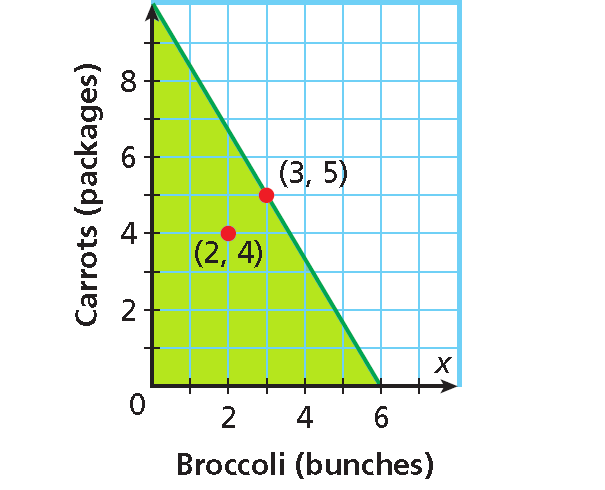
C. Give two combinations of vegetables that Lily can buy.
Two different combinations that Lily could buy for $7.50 or less are 2 bunches of broccoli and 4 packages of carrots, or 3 bunches of broccoli and 5 packages of carrots.
Kindly mail your feedback to v4formath@gmail.com
We always appreciate your feedback.
©All rights reserved. onlinemath4all.com
Recent Articles
-
Derivative of Absolute Value of x Using Limit Definition
Apr 23, 25 11:11 AM
Derivative of Absolute Value of x Using Limit Definition -
Digital SAT Math Problems and Solutions (Part - 149)
Apr 23, 25 02:33 AM
Digital SAT Math Problems and Solutions (Part - 149) -
Digital SAT Math Problems and Solutions (Part - 148)
Apr 22, 25 08:20 AM
Digital SAT Math Problems and Solutions (Part - 148)
