LINEAR VS EXPONENTIAL GROWTH
Subscribe to our ▶️ YouTube channel 🔴 for the latest videos, updates, and tips.
Linear Growth
Consider the relationship represented by the table shown below.
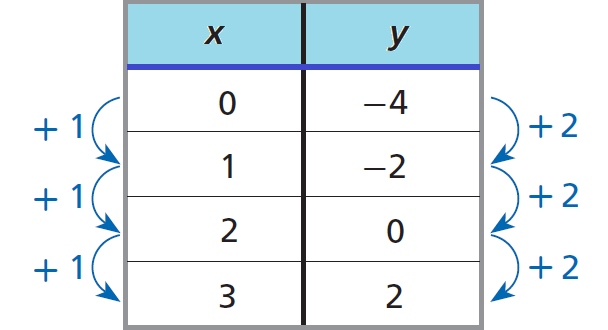
In the table above, a constant change of +1 in x corresponds to a constant change +2 in y.
Therefore, the relationship given in the table above represents linear growth, because each y-value is 2 more than the value before it.
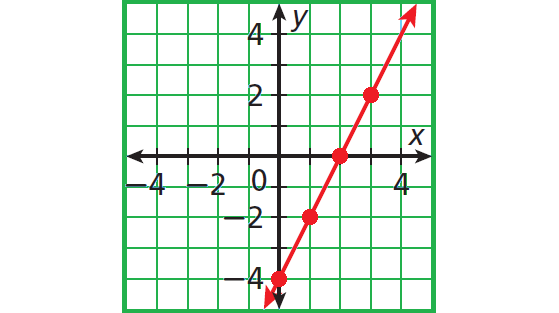
The points from this table lie on a line.
Exponential Growth
Consider the relationship represented by the table shown below.
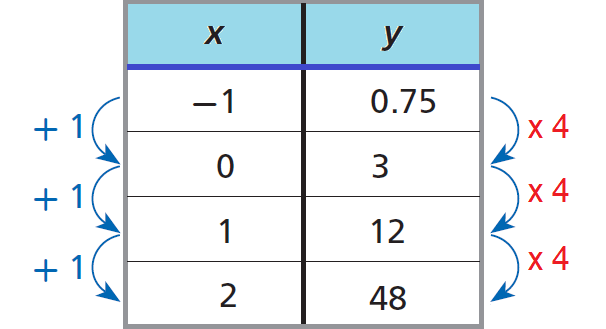
In the table above, a constant change of +1 in x corresponds to an increase in y by a constant factor of 4.
Therefore, the relationship given in the table above represents exponential growth, because each y-value is 4 times the value before it.
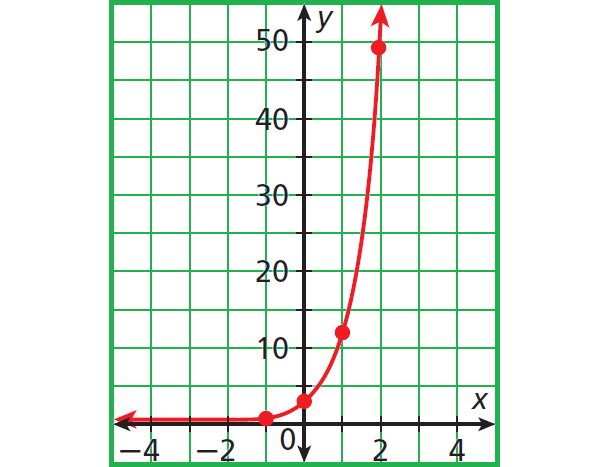
The points from this table lie on a smooth curve.
Linear vs Exponential Growth
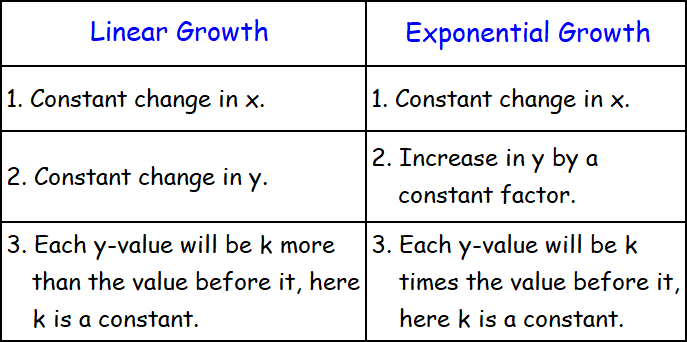
Remember that linear functions have constant differences. Exponential functions do not have constant differences, but they do have constant ratios.
In an exponential function, as the x-values increase by a constant amount, the y-values are multiplied a constant amount. This amount is the constant ratio and is the value of b in f(x) = abx.
Examples 1-2 : Tell whether each set of ordered pairs represents linear growth. Explain.
Example 1 :
{(2, 1), (5, 2), (8, 3), (11, 4)}
Solution :
Write the ordered pairs in a table and look for a pattern.
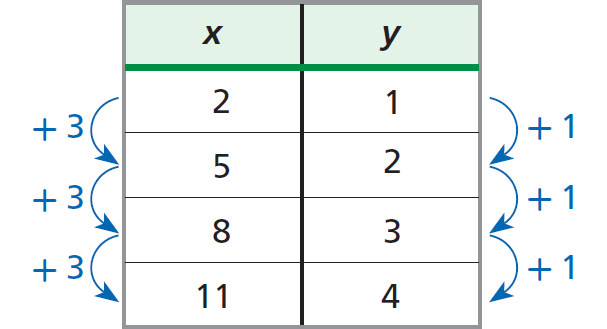
A constant change of +3 in x corresponds to a constant change of +1 in y.
Hence, the given set of ordered pairs represents linear growth.
Example 2 :
{(2, 1), (5, 2), (8, 3), (11, 4)}
Solution :
Write the ordered pairs in a table and look for a pattern.
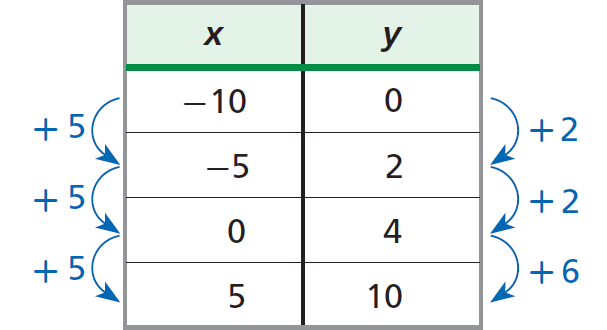
A constant change of +5 in x corresponds to different changes in y.
The given set of ordered pairs does not represent linear growth.
Examples 3-4 : Tell whether each set of ordered pairs represents exponential growth. Explain.
Example 3 :
{(-1, 1.5), (0, 3), (1, 6), (2, 12)}
Solution :
Write the ordered pairs in a table and look for a pattern.
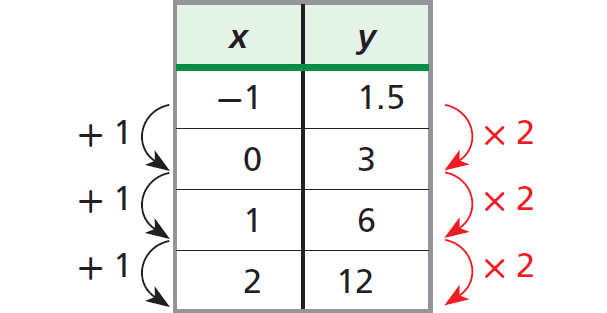
A constant change of +1 in x corresponds to an increase in y by a constant factor of 2.
Hence, the given set of ordered pairs represents exponential growth.
Example 4 :
{(-1, -9), (1, 9), (3, 27), (5, 45)}
Solution :
Write the ordered pairs in a table and look for a pattern.
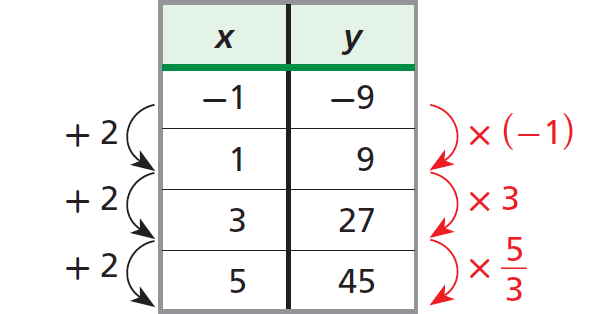
A constant change of +2 in x corresponds to an increase in y, but NOT by a constant factor.
The given set of ordered pairs does not represent exponential growth.
Example 5 :
Check whether the following equation represents a linear growth.
y = 2x + 3
Solution :
Substitute values for x with constant difference, say
x = 1, 2, 3, 4
Substitute those values of x in the given equation and evaluate the values of y.
When x = 1,
y = 2(1) + 3
= 2 + 3
= 5
When x = 2,
y = 2(2) + 3
= 4 + 3
= 7
When x = 3,
y = 2(3) + 3
= 6 + 3
= 9
When x = 4,
y = 2(4) + 3
= 8 + 3
= 11
When x = 1, 2, 3, 4,
y = 5, 7, 9, 11
A constant change of +1 in x corresponds to a constant change of +2 in y.
Hence, the given equation represents a linear growth.
Example 6 :
Check whether the following equation represents a linear growth.
y = 2(3)x
Solution :
Substitute values for x with constant difference, say
x = 0, 1, 2, 3
Substitute those values of x in the given equation and evaluate the values of y.
When x = 0,
y = 2(3)0
= 2(1)
= 2
When x = 1,
y = 2(3)1
= 2(3)
= 6
When x = 2,
y = 2(3)2
= 2(9)
= 18
When x = 3,
y = 2(3)3
= 2(27)
= 54
When x = 0, 1, 2, 3,
y = 2, 6, 18, 54
A constant change of +1 in x corresponds to an increase in y by a constant factor of 3.
Hence, the given equation represents an exponential growth.
Subscribe to our ▶️ YouTube channel 🔴 for the latest videos, updates, and tips.
Kindly mail your feedback to v4formath@gmail.com
We always appreciate your feedback.
About Us | Contact Us | Privacy Policy
©All rights reserved. onlinemath4all.com

Recent Articles
-
Problem Solving Strategies for SAT Math
Feb 17, 26 08:09 PM
Problem Solving Strategies for SAT Math -
SAT Math Challenge Problems
Feb 17, 26 07:01 PM
SAT Math Challenge Problems -
How to Solve Challenging Math Problems in SAT
Feb 17, 26 06:42 PM
How to Solve Challenging Math Problems in SAT

