MEASURES OF CENTER
A measure of center is a single number used to describe a set of numeric data.
A measure of center describes a typical value from the data set.
The mean and median are the two most commonly used measures of center, or central tendency. The mean, often called the average, is found by dividing the sum of values by the number of values.
The median is the value that is physically in the middle of an ordered data set. The mean of a data set may be affected by the presence of outliers. An outlier is a data value that is significantly higher or lower than the other values. For data that include outliers, the median may better represent the "typical" value.
We apply mean and median to real-world situations found in everyday life or society using models and using pencil and paper.
Mean or Average
The mean, or average, of a data set is the sum of the data values divided by the number of data values in the set.
Example :
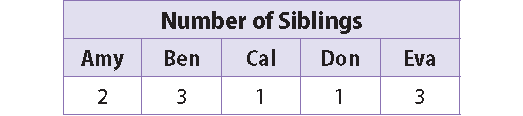
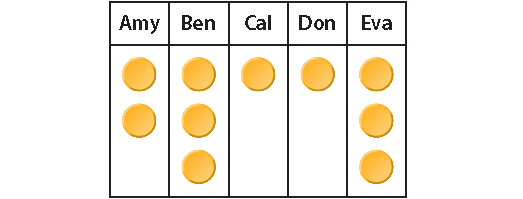
Peterson surveyed five of her friends to find out how many brothers and sisters they have. Her results are shown in the table.
Step 1 :
Model each person’s response as a group of counters.
Step 2 :
Now rearrange the counters so that each group has the same number of counters.

Step 3 :
Each group now has 2 counters. This value is the mean. This model demonstrates how the mean “evens out” the data values.
Step 4 :
Use numbers to calculate the mean.
The sum of the data values is
= 2 + 3 + 1 + 1 + 3
= 10
How many data values are in the set ?
5
Step 5 :
Mean = Sum of data values / Number of data values
Mean = 10 / 5
Mean = 2
Reflect :
1. Can the mean be greater than the greatest value in a data set ? Why or why not ?
No; the group(s) with the greatest number of counters will lose counters to other groups in order to “even out” the data set. So the mean will not be greater than the greatest value.
2. Suppose you have a data set in which all of the values are 2. What is the mean ?
2
Median
The median represents the middle value of an ordered data set.
Example :
A coach records the distances that some cross-country team members ran last week. Find the median.
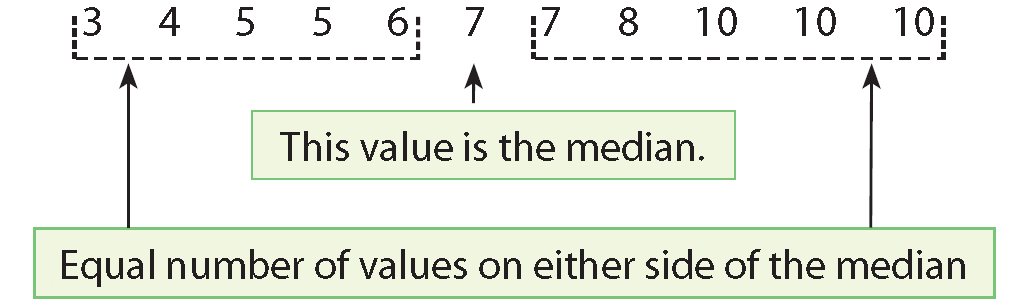
Distances Run
Distances Run
|
Cara Rob Mara Olivia Paul Chris Amir Iris Alex Tara Ned |
3 miles 5 miles 7 miles 10 miles 10 miles 4 miles 7 miles 5 miles 8 miles 10 miles 6 miles |
Solution :
Write the data values in order from least to greatest.
Reflect :
Which units are used for the data in Example 1 ? If the coach had recorded some distances in kilometers and some in miles, can you still find the median of the data? Explain.
Miles; no, not unless the coach converts all the data to the same units.
Comparing the Mean and the Median
The mean and median of a data set may be equal, very close to each other, or very different from each other. For data sets where the mean and median differ greatly, one likely describes the data set better than the other.
Example :
Luka’s final exam scores for this semester are 70, 72, 99, 72, and 69.
Questions (i) :
Find the mean.
Answer :
Mean = (70 + 72 + 99 + 72 + 69) / 5
Mean = 382 / 5
Mean = 76.4
Questions (ii) :
Write the data values in order from least to greatest and find the median.
Answer :
69, 70, 72, 72, 99
Number of observations (n) = 5
Median = [(n + 1)/2] th value
Substitute n = 5.
Median = [(5 + 1)/2]th value
Median = 3rd value
Median = 72
Questions (iii) :
What is the difference between the mean and the median ? Why ?
Answer :
Difference between mean and median = |76.4 - 72|
Difference between mean and median = 4.4
Reason :
The mean is affected by the data value 99, which is much greater than the other data values. The median is not affected by this value.
Questions (iv) :
Which is a better description of Luka’s typical exam score? Explain your thinking.
Answer :
Median; the median is closer in value to most of the data values than the mean.
Reflect :
Which measure of center best describes the following data? Explain why.
Jared’s points scored in basketball games :
12, 20, 32, 8, 14, 11, 15
The median best describes the data. The mean is 16 and the median is 14. The mean is affected by the value 32 and is larger than the central numbers in the data.
Kindly mail your feedback to v4formath@gmail.com
We always appreciate your feedback.
©All rights reserved. onlinemath4all.com
Recent Articles
-
Digital SAT Math Problems and Solutions (Part - 110)
Feb 13, 25 12:08 AM
 Digital SAT Math Problems and Solutions (Part - 110)
 -
Digital SAT Math Problems and Solutions (Part - 109)
Feb 13, 25 12:07 AM
 Digital SAT Math Problems and Solutions (Part - 109)
 -
Pre Calculus Problems and Solutions (Part - 10)
Feb 12, 25 08:14 AM
 Pre Calculus Problems and Solutions (Part - 10)