MEASURES OF VARIABILITY
The second important characteristic of a distribution is given by variability.
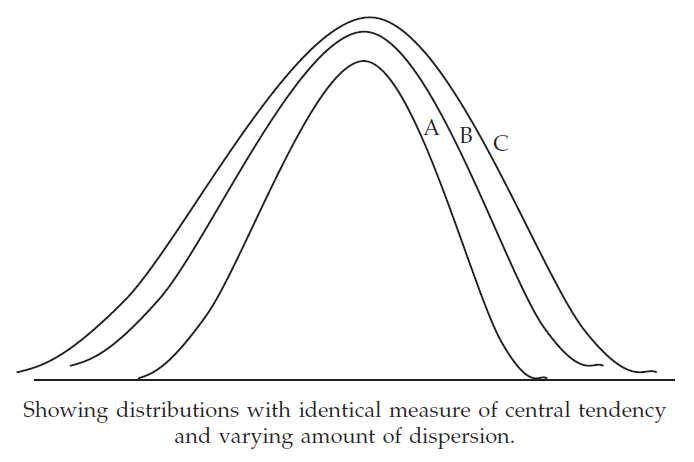
Two distributions may be identical in respect of its first important characteristic i.e. central tendency and yet they may differ on account of scatterness.
The following figure shows a number of distributions having identical measure of central tendency and yet varying measure of scatterness. Obviously, distribution is having the maximum amount of variability.

Variability for a given set of observations may be defined as the amount of deviation of the observations, usually, from an appropriate measure of central tendency.
Measures of variability may be broadly classified into
1) Measures of absolute variability
2) Measures of relative variability
Measures of Absolute Variability
Measures of absolute variability are classified into
Measures of Relative Variability
Likewise, we have the following measures of relative variability
(ii) Coefficient of Mean Deviation
(iii) Coefficient of Variation
(iv) Coefficient of Quartile Deviation
Difference Between Absolute and Relative Variability
We may note the following points of distinction between the measures of absolute and relative variability.
1) Absolute measures are dependent on the unit of the variable under consideration whereas the relative measure of variability is unit free.
2) For comparing two or more distributions, relative measures and not absolute measure of variability are considered.
3) Compared to absolute measures of variability, relative measure of variability is difficult to compute and comprehend.
Characteristics for an Ideal Measure of Variability
As discussed in this section, an ideal measure of variability should have the following properties.
(i) It should properly defined
(ii) It should be easy to comprehend
(iii) It should be simple to compute
(iv) It should be based on all the observations,
(v) It should be unaffected by sampling fluctuations
(vi) It should be amenable to some desirable mathematical treatment.
Review
We may now have a review of the different measures of variability on the basis of their relative merits and demerits.
1. Standard deviation, like AM, is the best measure of variability.
2. It is rigidly defined, based on all the observations, not too difficult to compute, not much affected by sampling fluctuations and moreover it has some desirable mathematical properties.
3. All these merits of standard deviation make SD as the most widely and commonly used measure of variability.
4. Range is the quickest to compute and as such, has its application in statistical quality control. However, range is based on only two observations and affected too much by the presence of extreme observation(s).
5. Mean deviation is rigidly defined, based on all the observations and not much affected by sampling fluctuations.
6. However, mean deviation is difficult to comprehend and its computation is also time consuming and laborious. Furthermore, unlike SD, mean deviation does not possess mathematical properties.
7. Quartile deviation is also rigidly defined, easy to compute and not much affected by sampling fluctuations. The presence of extreme observations has no impact on quartile deviation since quartile deviation is based on the central fifty-percent of the observations.
8. However, quartile deviation is not based on all the observations and it has no desirable mathematical properties.
9. Nevertheless, quartile deviation is the best measure of variability for open-end classifications.
Kindly mail your feedback to v4formath@gmail.com
We always appreciate your feedback.
©All rights reserved. onlinemath4all.com
Recent Articles
-
Digital SAT Math Problems and Solutions (Part - 146)
Apr 18, 25 06:52 AM
Digital SAT Math Problems and Solutions (Part - 146) -
Logarithmic Derivative Problems and Solutions
Apr 16, 25 09:25 PM
Logarithmic Derivative Problems and Solutions -
Digital SAT Math Problems and Solutions (Part - 145)
Apr 16, 25 12:35 PM
Digital SAT Math Problems and Solutions (Part - 145)

