PIECEWISE DEFINED FUNCTIONS WORKSHEET
Problem 1 :
If f(x) = |x - 2|, then redefine f(x) as a piecewise function.
Problem 2 :
Graph the piecewise-defined function shown below :

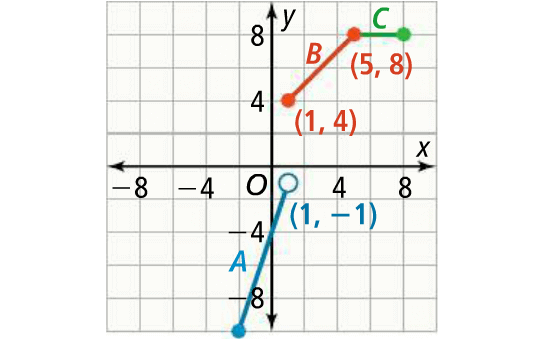
Problem 3 :
What is the rule that describes the piecewise-defined function shown in the graph ?

Answers
Problem 1 :
If f(x) = |x - 2|, then redefine f(x) as a piecewise function.
Solution :
Take the stuff inside the absolute value and equate it to zero.
x - 2 = 0
x = 2
From x = 2, we can set three conditions as shown below.
x < 2, x = 2, x > 2
Case (i) :
When x < 2,
(x - 2) < 0
So, we have
f(x) = - (x - 2)
f(x) = - x + 2
f(x) = 2 - x
Case (ii) :
When x = 0,
(x - 2) = 0
So, we have
f(x) = 0
Case (iii) :
When x > 2,
(x - 2) > 0
So, we have
f(x) = x - 2
Hence, the given absolute value function is redefined as piecewise function as shown below :

Problem 2 :
Graph the piecewise-defined function shown below :

What are the domain and range ? Over what intervals is the function increasing or decreasing ?
Solution :
Step 1 :
Sketch the graph of y = 4x + 11 for values of x between -10 and -2.
We can consider the following points to sketch the graph of y = 4x + 11 :
* y = 4x + 11 is a linear equation. Then, its graph will be a straight line.
* y = 4x + 11 is in slope intercept form y = mx + b.
* Comparing
y = 4x + 11 and y = mx + b
we get a positive slope m = 4.
So, the graph of y = 4x + 11 is a rising line.
Step 2 :
Sketch the graph of y = x2 - 1 for values of x between -2 and 2.
We can consider the following points to sketch the graph of y = x2 - 1 :
* y = x2 - 1 is a quadratic equation. Then, its graph will be a parabola.
* The sign of x2 in y = x2 - 1 is positive. So, the graph will be a open upward parabola.
* We can write y = x2 - 1 in vertex form as shown below.
y = (x - 0)2 - 1
* Comparing
y = (x - h)2 + k and y = (x - 0)2 - 1
we get the vertex (h, k) = (0, -1)
So, the graph of y = x2 - 1 is a open upward parabola with the vertex (0, -1).
Step 3 :
Sketch the graph of y = x + 1 for values of x between 2 and 10.
We can consider the following points to sketch the graph of y = x + 1 :
* y = x + 1 is a linear equation. Then, its graph will be a straight line.
* y = x + 1 is in slope intercept form y = mx + b.
* Comparing
y = x + 1 and y = mx + b
we get a positive slope m = 1.
So, the graph of y = x + 1 is a rising line.
Graph :
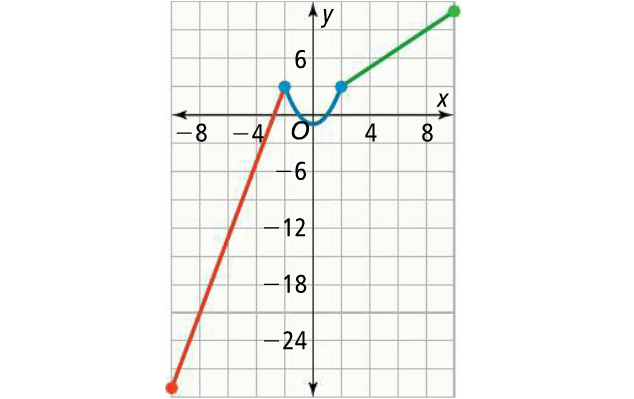
Domain and Range :
To determine the range, calculate the y-values that correspond to the minimum and maximum x-values on the graph.
For this graph, these values occur at the endpoints of the domain of the piecewise function,
-10 ≤ x ≤ 10
So, the domain is {x | -10 ≤ x ≤ 10}.
Evaluate y = 4x + 11 for x = -10 :
y = 4(-10) + 11
y = - 40 + 11
y = - 29
Evaluate y = x + 1 for x = 10 :
y = 10 + 1
y = 11
So, the range is {y | -29 ≤ x ≤ 11}.
Increasing and Decreasing Intervals :
The function is increasing when
- 10 < x < -2 and 0 < x < 10
The function is decreasing when
- 2 < x < 0
Problem 3 :
What is the rule that describes the piecewise-defined function shown in the graph ?

Solution :
Step 1 :
Notice three separate linear pieces that make up the function.
Step 2 :
Determine the domain of each segment.
Step 3 :
For each segment, use the graph to locate points on the line and to find the slope.
Step 4 :
We can use the slope-intercept form of a linear equation
f(x) = mx + b
to define the function of each segment.
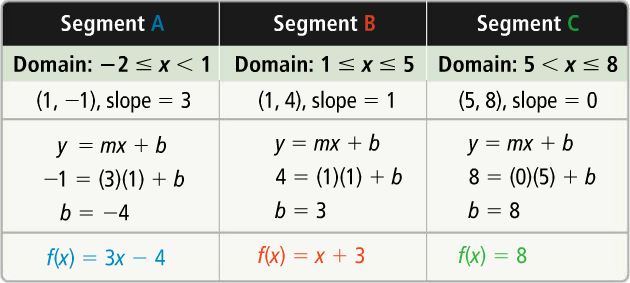
The rule for this function is :

Kindly mail your feedback to v4formath@gmail.com
We always appreciate your feedback.
©All rights reserved. onlinemath4all.com
Recent Articles
-
Digital SAT Math Problems and Solutions (Part - 139)
Apr 08, 25 08:18 AM
Digital SAT Math Problems and Solutions (Part - 139) -
Digital SAT Math Problems and Solutions (Part - 138)
Apr 07, 25 07:22 AM
Digital SAT Math Problems and Solutions (Part - 138) -
Implicit Differentiation Problems and Solutions
Apr 06, 25 11:54 PM
Implicit Differentiation Problems and Solutions
