PROBLEMS ON PIE CHART WITH SOLUTIONS
Problem 1 :
A survey of eye color in a class of 30 teenagers revealed the following results
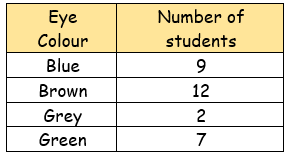
a) Illustrate these results on a pie chart.
b) What percentage of the group have:
i) green eyes ii) blue or grey eyes?
Solution :
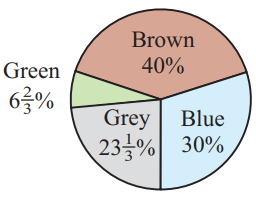
(a)
(b)
(i) Percentage of people who have green eyes = 6 2/3%
(ii) Percentage of people who have blue or gray eyes
= (23 1/3 + 30)%
= 53 1/3%
Problem 2 :
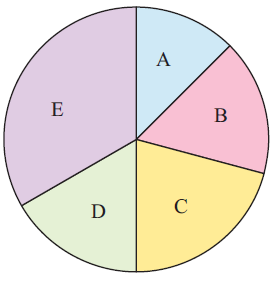
A business has a major store in five cities. We will call the stores A, B, C, D and E. The pie chart shows the proportion of sales for each store.
a) Use your protractor to measure the size of each sector angle.
b) If the total sales from all stores is $72 million, find the sales made by each of the stores.
Solution :
a) A = 45o, B = 60o, C = 75o, D = 60o, E = 120o
Area of sector = (θ/360) x πr2
b) Store A :
= (45/360) x 72
= 9 million
|
Store B : = (60/360) x 72 = 12 million |
Store C : = (75/360) x 72 = 15 million |
|
Store D : = (60/360) x 72 = 12 million |
Store E : = (120/360) x 72 = 24 million |
Problem 3 :
On a pie chart a sector has an angle of 30o and this represents 171 people.
a) How many people are represented by the whole chart?
b) How many people would be represented by a sector of size 72o ?
Solution :
(a) Area of sector with an angle 30o and it represents 171 people.
(θ/360) x πr2 = 171
(30/360) x πr2 = 171
πr2 = 171/0.0833
πr2 = 2052 people
So, the whole chart represents 2052 people.
(b) Area of sector with angle measure 72
= (72/360) x 2052
= 410 people
Problem 4 :
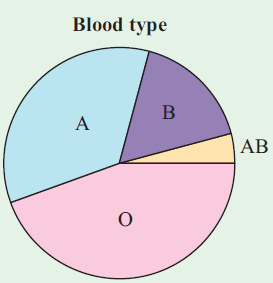
A random sample of people are surveyed about their blood type. The results are displayed in the pie chart opposite.
a) Use your protractor to measure the size of each sector angle.
b) What percentage of people surveyed have type A blood?
c) If 7 of the people surveyed have type AB blood, how many people were surveyed in total?
Solution :
a) AB = 15o, O = 160o, A = 125o, B = 60o
b) Percentage of of people surveyed for type A :
= (125/360) x 100%
= 34.7%
c) Number of people surveyed have type AB = 7
(15/360) x πr2 = 7
πr2 = 7/0.0416
= 168 people
Number of people surveyed is 168 people.
Problem 5 :
A pie chart below shows what games consoles the students at Helanbacagun Primary School in North Wales received for Christmas.

If 6 lucky students got a ZX81, how many students got an XBOX one ?
Solution :
Number of students got ZX81 = 6
(θ/360) x πr2 = 6
(30/360) x πr2 = 6
πr2 = 6 x (360/30)
πr2 = 6 x 12
πr2 = 72
Area of circle is 72 square units.
Number of students got XBOX one = (θ/360) x πr2
= (100/360) x 72
= 10 x 2
= 20 students.
Problem 6 :
A pie chart shows how a group of children travel to school.

195 children go to school by bike. How many children take the bus to school ?
a) 325 b) 420 c) 315 d) 400
Solution :
Number of children go to school by bike = 195
(θ/360) x πr2 = 195
Here θ = 65
(65/360) x πr2 = 195
πr2 = 195 x (360/65)
πr2 = 1080
Number of children go to school by bus
= (θ/360) x πr2
= (140/360) x 1080
= 420
So, the number of children go by bus is 420.
Problem 7 :
A bag contains red, white and black counters. The pie chart below shows information about the counters in the bag.

There are 48 counters in the bag. How many counters are black ?
Solution :
Angle measure at black = 360 - (90 + 120)
= 360 - 210
= 150
Total number of counters = 48
Number of counters in black = (θ/360) x πr2
= (150/360) x 48
= 20
So, total number of counters in black is 20.
Problem 8 :
A class of 36 pupils were asked to pick their favorite color from green, purple or red.

(i) The whole year group were asked the same question. The pie chart looked exactly the same. If 30 pupils chose purple how many pupils are in the year group ?
Solution :
Total number of pupils = 36
Number of people who chose purple = 30
Angle measure for purple = 180 - 30
= 150
Area of sector = (θ/360) x πr2
(150/360) x πr2 = 30
πr2 = 30 x (360/150)
πr2 = 72
The entire circle will represents 72, then the total number of pupils in the group is 72.
Problem 9 :
A class of 36 pupils were asked to pick their favorite color from green, purple or red.
(i) What is the probability that a pupil chosen at random chose purple or green ?
(ii) What is the probability that a pupil chosen at random chose red or green ?
Solution :
(i)
Total number of pupils = 36
Number of pupil who choose green = (30/360) x 36
= 3
Number of pupil who choose purple = (θ/360) x πr2
= (150/360) x 36
= 15
Number of pupil who choose purple or green = 15 + 3
= 18
Probability of choosing purple or green = 18/36
= 1/2
(ii) Number of pupil who choose red = 36 - 18
= 18
Number of pupil who choose red or green = 18 + 3
= 21
Probability of choosing pupil who choose red or green
= 21/36
= 7/12
Kindly mail your feedback to v4formath@gmail.com
We always appreciate your feedback.
©All rights reserved. onlinemath4all.com
Recent Articles
-
Digital SAT Math Problems and Solutions (Part - 134)
Apr 02, 25 12:40 AM
 Digital SAT Math Problems and Solutions (Part - 134)
 -
SAT Math Resources (Videos, Concepts, Worksheets and More)
Apr 02, 25 12:35 AM
SAT Math Resources (Videos, Concepts, Worksheets and More) -
Digital SAT Math Problems and Solutions (Part 135)
Apr 02, 25 12:32 AM
 Digital SAT Math Problems and Solutions (Part 135)