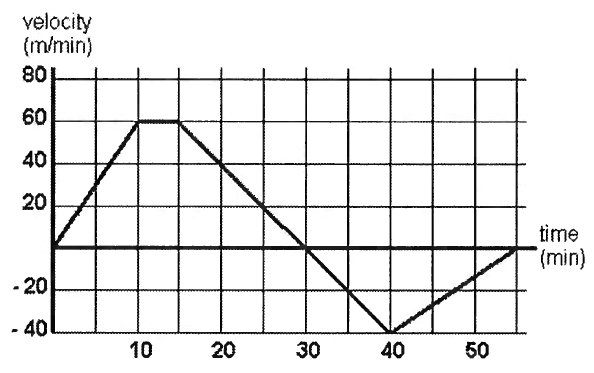
PROPERTIES OF LINE GRAPHS
Line graphs consist of straight line segments or curves.
They are used to show how one quantity varies in relation to another
Since the quantities may take different values, we say they are variables.
In general when quantities vary, one is dependent on the other.
We say that the dependent variable depends on the independent variable.
Note :
The independent variable is placed on the horizontal axis and the dependent variable is placed on the vertical axis.
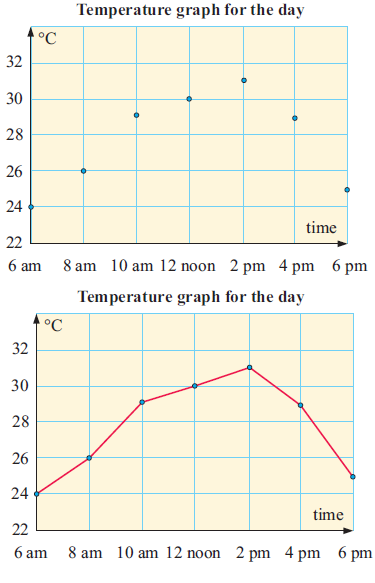
We join the dots together either with a smooth curve or with straight line segments.
The graph below is a line graph which connects the dots.
Example 1 :
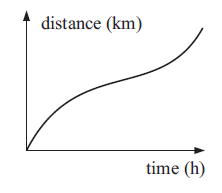
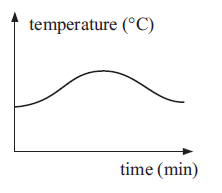
For each of the following graphs, state the dependent and independent variables:
Solution :
Time is on x axis, so it is independent.
Distance is on y axis, so it is dependent.
Example 2 :
Solution :
Time is on x axis, so it is independent.
Temperature is on y axis, so it is dependent.
Example 3 :
For each graph, state whether it is:
A) increasing
B) decreasing
C) increasing in some sections and decreasing in others
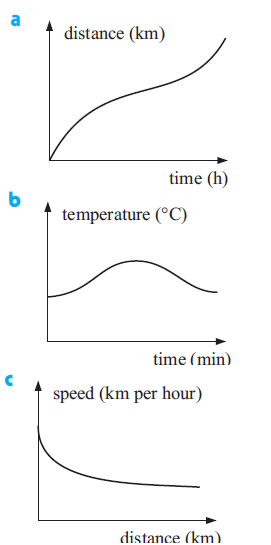
Solution :
(a) By observing the given graph from left to right, it is increasing.
So option A is correct.
(b) By observing the graph from left to right, it is increasing somewhere and decreasing somewhere.
So, increasing in some sections and decreasing in others option C is correct.
(c) By observing the graph from left to right, it is decreasing.
So, option B is correct.
Example 4 :
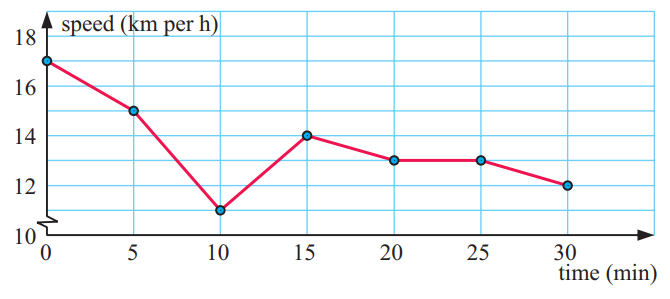
This data set shows the speed of a runner at various times during a cross country race.

a) State which is the dependent and which is the independent variable.
b) Draw a point graph to display the data. Make sure the independent variable is on the horizontal axis.
c) Connect the points on your graph with straight line segments to form a line graph.
Solution :
(a) Time should be placed on x-axis, speed should be placed on y-axis.
Time ==> x-axis ==> independent
Speed ==> y-axis ==> dependent
(b and c)
Example 5 :
The data set below records the progress of a speed skater in a 500 m race.
|
Time(s) 0 5 10 15 20 25 30 35 39.6 |
Distance(m) 0 34 79 142 226 291 350 429 500 |
a) State which is the dependent and which is the independent variable.
b) Draw a point graph to display the data. Make sure the independent variable is on the horizontal axis.
c) Connect the points on your graph with a smooth curve.
d) Comment on whether the graph is decreasing or increasing.
Solution :
(a) On x axis, we place time. So, time is independent and distance is dependent.
(b) & (c)
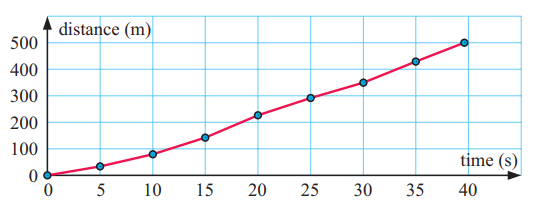
(d) The graph is increasing.
Example 6 :
Emma travelled to her Grandmother’s house and back. The distance-time graph shows information about her journey
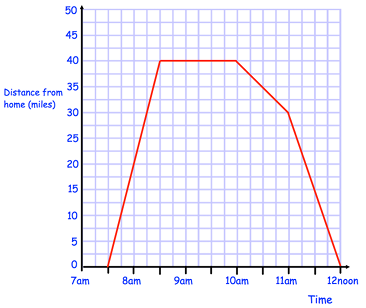
(a) What time did Emma begin her journey?
(b) How far was Emma from home at 8am ?
(c) How long did Emma stay at her Grandmother’s house?
(d) What time did Emma leave her Grandmother’s house?
(e) How far was Emma from home at 11:45?
Solution :
a) By observing the time graph, we know that she has began her journey at 7.30 am
b) She was 20 miles away from the home at 8 am.
c) From 8.30 am to 10 am, she will be at her grandmother's house.
d) Emma started at 10 am from her Grandmother's house.
e) At 11.45 am, she was 10 miles away from home.
Example 7 :
John left his home and walked 3 blocks to his school, as shown in the accompanying graph.
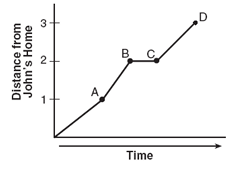
What is one possible interpretation of the section of the graph from point B to point C?
a) John arrived at school and stayed throughout the day.
b) John waited before crossing a busy street.
c) John returned home to get his mathematics homework.
d) John reached the top of a hill and began walking on level ground.
Solution :
There is no changes in the speed, so option b is correct.
Example 8 :
The accompanying graph shows the amount of water left in Rover's water dish over a period of time.
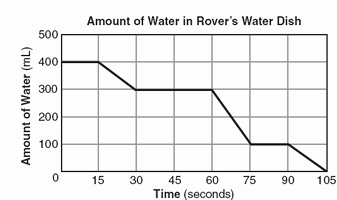
How long did Rover wait from the end of his first drink to the start of his second drink of water?
a) 75 sec b) 10 sec c) 60 sec d) 30 sec
Solution :
Option d is correct.
Example 9 :
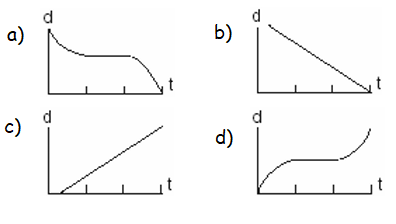
A bug travels up a tree, from the ground, over a 30-second interval. It travels fast at first and then slows down. It stops for 10 seconds, then proceeds slowly, speeding up as it goes. Which sketch best illustrates the bug's distance (d) from the ground over the 30 second interval (t) ?
Solution :
Option d says it travels at fast then stops for some seconds there is no move and then going little slowly. So, it is correct.
Example 10 :
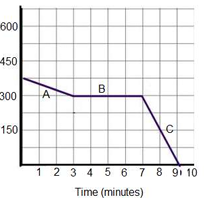
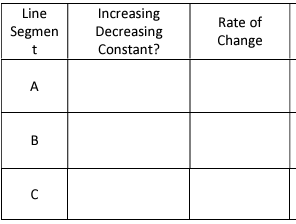
An Airplane is descending to land at the airport. During its descent it had to fly in circles until the landing was cleared of other planes. Explain what is occurring during each of the segments. Is the graph increasing, decreasing, or constant? What is the speed of the airplane during that period of time?
Solution :
Line segment at A, decreasing. Rate of change is negative.
Line segment at B, constant. Rate of change is constant.
Line segment at C, decreasing. Rate of change is negative.
Kindly mail your feedback to v4formath@gmail.com
We always appreciate your feedback.
©All rights reserved. onlinemath4all.com
Recent Articles
-
Digital SAT Math Problems and Solutions (Part - 150)
Apr 25, 25 11:46 AM
Digital SAT Math Problems and Solutions (Part - 150) -
AP Calculus AB Problems with Solutions (Part - 19)
Apr 24, 25 11:10 PM
AP Calculus AB Problems with Solutions (Part - 19) -
AP Calculus AB Problems with Solutions (Part - 18)
Apr 24, 25 11:06 PM
AP Calculus AB Problems with Solutions (Part - 18)
