RATIOS RATES TABLES AND GRAPHS
Subscribe to our ▶️ YouTube channel 🔴 for the latest videos, updates, and tips.
In this section, you will learn how to determine the ratio or rate of change of a relation from a table or graph. Students will also compare and contrast ratios, rates, and rates of change.
Example 1 :
Students in Mr. Webster’s science classes are doing an experiment that requires 250 milliliters of distilled water for every 5 milliliters of ammonia. The table shows the amount of distilled water needed for various amounts of ammonia.

Question (i) :
Use the numbers in the first column of the table to write a ratio of distilled water to ammonia.
Answer :
100 ml distilled water/2 ml ammonia (or) 100 : 2
Question (ii) :
How much distilled water is used for 1 milliliter of ammonia?
Answer :
From the first column of the table, the ratio of distilled water to ammonia is
100 ml water/2 ml ammonia
To find the quantity of distilled water used for 1 milliliter of ammonia, we have to make the second quantity (ammonia) as 1.
100 ml distilled water : 2 ml ammonia = (100 ÷ 2)/(2 ÷ 2)
100 ml distilled water : 2 ml ammonia = 50/1
That is,
50 ml distilled water / 1 ml ammonia
The quantity of distilled water used for 1 milliliter of ammonia is 50 ml.
Question (iii) :
Use your answer from question 2, write another ratio of distilled water to ammonia.
Answer :
To write another ratio from the answer of question 2, we have find an equivalent ratio to 50 : 1.
To find equivalent ratio of the given ratio, we have to multiply both the terms of the ratio by the same non zero number, say "2".
Then, we have
(50 x 2) : (1 x 2) = 100 : 2
Therefore, another ratio of distilled water to ammonia is 100 : 2
Question (iv) :
Check whether the two ratios from answers of question 1 and question 2 are equivalent or not equivalent.
Answer :
The two ratios from the answers of question 1 and 2 are
100 : 2 and 50 : 1
Let us check, whether two rations 100 : 2 and 50 : 1 are equivalent or not equivalent.
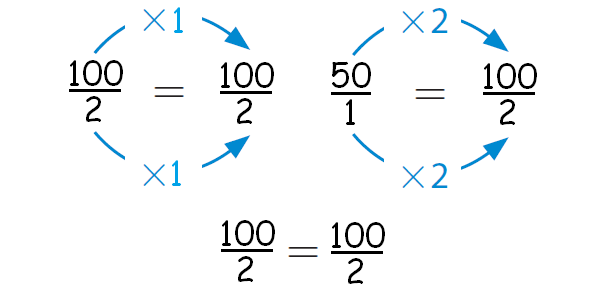
From the above working, it is clear that the two ratios 100 : 2 and 50 : 1 are equivalent.
Question (v) :
Complete the table. What are the equivalent ratios shown in the table?
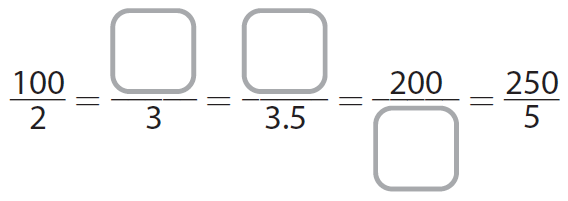
Answer :
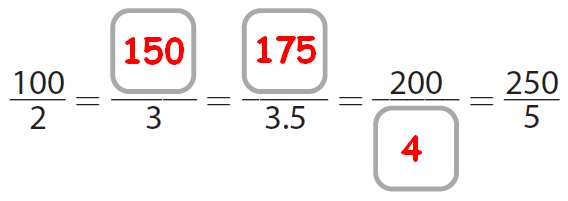
For the first blank :
(100 ÷ 2)/(2 ÷ 2) = 50/1
(50 x 3)/(1 x 3) = 150/3
For the second blank :
(100 ÷ 2)/(2 ÷ 2) = 50/1
(50 ÷ 2)/(1 ÷ 2) = 25/0.5
(25 x 7)/(0.5 x 7) = 175/3.5
For the third blank :
(100 x 2)/(2 x 2) = 200/4
Then, we have
Example 2 :
Look at the picture given below.
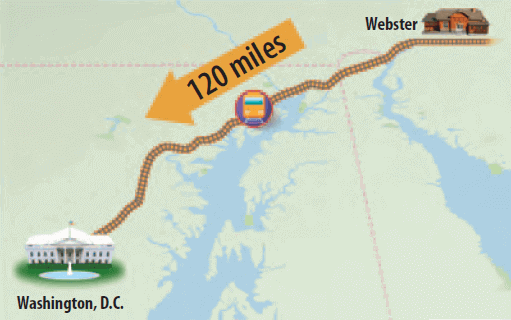
An express train travels from Webster to Washington, D.C., at a constant speed and makes the trip in 2 hours.
Question (i) :
Make a table to show the distance the train travels in various amounts of time.
Answer :
Write a ratio of distance to time to find the rate.

Use the unit rate to make a table.

Question (ii) :
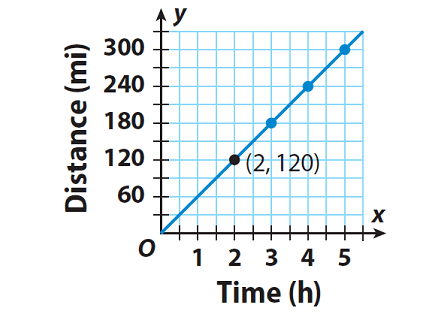
Graph the information from the table.
Answer :
Write ordered pairs with time as the x-coordinate and distance as the y-coordinate.
(1, 60), (2, 120), (3, 180), (4, 240), (5, 300)
Graph the ordered pairs. Fractions and decimals can represent times and distances, so connect the points.
Question (iii) :
Use the graph to find how long the train takes to travel 90 miles.
Answer :
When we look at the graph carefully, the value on y - axis which is corresponding to 1.5 on x-axis is 90.
Look at the graph given below.
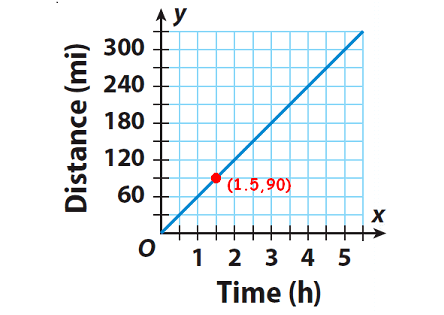
When we look at the above graph carefully, the value on y- axis which is corresponding to the value 1.5 on x-axis is 90.
The point (1.5, 90) is on the graph, so the train takes 1.5 hours.
Subscribe to our ▶️ YouTube channel 🔴 for the latest videos, updates, and tips.
Kindly mail your feedback to v4formath@gmail.com
We always appreciate your feedback.
About Us | Contact Us | Privacy Policy
©All rights reserved. onlinemath4all.com

Recent Articles
-
Digital SAT Math Problems and Solutions (Part - 5)
Feb 20, 26 09:29 PM
Digital SAT Math Problems and Solutions (Part - 5) -
Digital SAT Math Problems and Solutions (Part - 4)
Feb 20, 26 05:55 AM
Digital SAT Math Problems and Solutions (Part - 4) -
Digital SAT Math Problems and Solutions (Part - 3)
Feb 20, 26 05:37 AM
Digital SAT Math Problems and Solutions (Part - 3)


