READING BAR GRAPH QUESTIONS
Problem 1 :
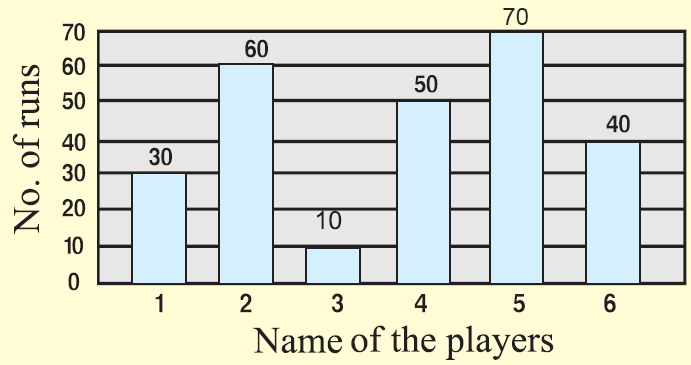
The total number of runs scored by few players in one-day match is given in the bar graph.
Questions :
1. Which player did score the maximum runs ?
2. What is the ratio between the runs scores by player 2 and player 5 ?
3. What is the difference between the runs scored by player 1 and 4 ?
4. What percentage of runs did player 5 score more than player 4 ?
Solution :
1. When read the above bar graph, it is clear that player no.5 scored the maximum runs. That is 70.
2. Player 2 : Player 5 = 60 : 70 = 6 : 7.
3. Difference = |60 - 50| = 10.
4. Difference between the runs scored by player 4 and 5 is
= 70 - 50
= 20
Required percentage = (20/50) x 100%
= 40%
Problem 2 :
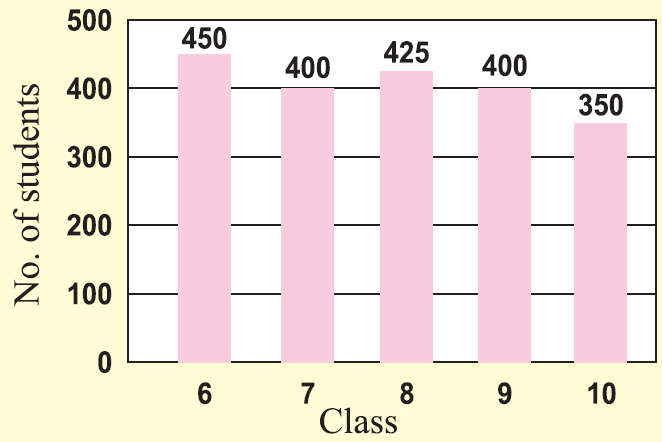
The number of students in each class of a school is given in the bar graph.
Questions :
1. In which class, is the student strength maximum ?
2. What is the ratio between the strengths of class 9 and class 10 ?
3. What is the difference between the strengths in class 8 and class 10 ?
4. What percentage of strength does class 6 have more than class 7 ?
Solution :
1. When read the above bar graph, it is clear that the class 6 has the maximum strength. That is 450.
2. Class 9 : Class 10 = 400 : 350 = 8 : 7.
3. Difference = |425 - 350| = 75.
4. Difference between the strengths in class 6 and class 7 is
= 450 - 400
= 50
Required percentage = (50/400) x 100%
= 12.5%
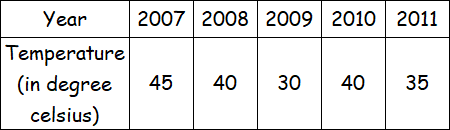
Problem 3 :
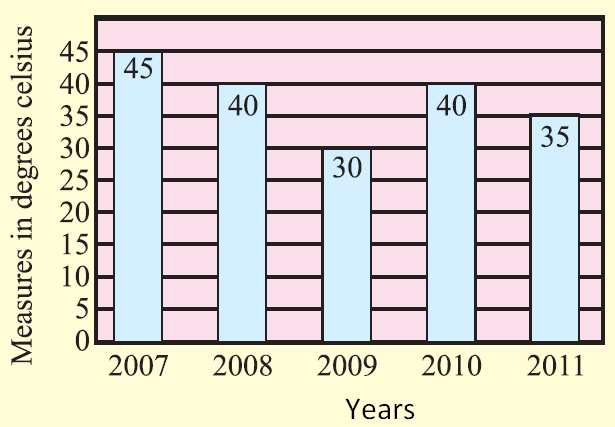
The average temperature during the month of April in a city during the year 2007 to 2012 is given. Draw bar graph for the data.
Solution :
Problem 4 :
The results of a maths test taken by a group of students is summarised on the bar chart below.

If any students scoring between 10 and 20 was given a gold start, any students scoring between 20 and 30 was given 2 gold stars, between 30 and 40 was given 3 gold stars, and scoring more than 40 was given 5 gold stars, how many gold stars were the group awarded in total ?
Solution :
To find the total number of gold stars given, we have to find the number of students receive gold using frequency.
|
Marks 0 to 10 10 to 20 20 to 30 30 to 40 40 to 50 |
Frequency 1 2 3 4 2 |
Total number of gold stars = 2(1) + 3(2) + 4(3) + 2(5)
= 2 + 6 + 12 + 10
= 30
Problem 5 :

The difference of number of students passed to those failed is minimum in which year?
A. 1991-92 B. 1992-93 C. 1993-94
D. 1994-95
Solution :
The difference of number of students passed in 1991-92
= 150 - 100
= 50
The difference of number of students passed in 1992-93
= 200 - 100
= 100
The difference of number of students passed in 1993-94
= 300 - 50
= 250
The difference of number of students passed in 1994-95
= 250 - 100
= 150
So, in 1992 - 93 the difference of number of students passes is minimum.
Problem 5 :
The chart below show information about a rainforest.

In the month that has the highest average temperature, what is the average rainfall?
Solution :
In the month of April, the highest average temperature is registered.
In the month of April, the average rainfall is 160 mm.
Problem 6 :
The diagram below shows the number of computers that members of a class had in their homes.

What is the total number of computers owned by the whole class ?
Solution :
Number of children they dont have even one computer at home = 3
Number of children they have one computer at home = 12
Number of children they have two computers at home = 7
Number of children they have three computers at home = 1
Total number of computers
= 3(0) + 12(1) + 7(2) + 1(3)
= 0 + 12 + 14 + 3
= 29
So, total number of computers is 29.
Problem 7 :
The bar chart below shows the marks out of 10 obtained by some pupils in the test.

a) Four pupils scored seven out of ten on the test. Fill this on the chart.
b) What was the most common mark ?
c) How many pupils scored 6 marks ?
d) Calculate how many pupils took the test ?
Solution :
a)

b) 6 students who has received 5 marks and this is the common mark.
c) Number of pupil scored 6 marks is 5.
d) Total number of pupils
= 1 + 3 + 3 + 6 + 5 + 4 + 2 + 2 + 3
= 29
So, 29 pupil took the test.

Kindly mail your feedback to v4formath@gmail.com
We always appreciate your feedback.
©All rights reserved. onlinemath4all.com
Recent Articles
-
Permutation Problems with Solutions
May 08, 25 12:28 PM
Permutation Problems with Solutions -
Digital SAT Math Problems and Solutions (Part - 159)
May 08, 25 01:39 AM
 Digital SAT Math Problems and Solutions (Part - 159)
 -
Digital SAT Math Problems and Solutions (Part - 158)
May 06, 25 11:00 AM
 Digital SAT Math Problems and Solutions (Part - 158)