REFLECTING A GRAPH IN THE HORIZONTAL OR VERTICAL AXIS
How to find the graph of reflection of the horizontal or vertical axis :
Suppose f is a function. Define functions g and h by
g(x) = −f(x) and h(x) = f(−x).
Then
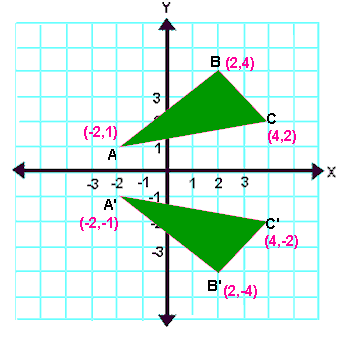
- The graph of g is the reflection of the graph of f through the horizontal axis;
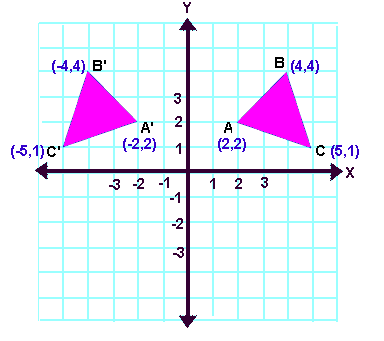
- The graph of h is the reflection of the graph of f through the vertical axis.
Important Note :
The domain of g is the same as the domain of f, but the domain of h is obtained by multiplying each number in the domain of f by −1.
The procedure for reflecting the graph of a function through the horizontal axis is illustrated by the following examples:
Question 1 :
Define a function g by
g(x) = −f(x)
where f is the function defined by f(x) = x2, with the domain of f the interval [−1, 1].
(a) Find the domain of g.
(b) Find the range of g.
(c) Sketch the graph of g.
Solution :
From the given question g(x) = - f(x), we come to know that, we have to perform horizontal reflection.
(a) According to the definition domain of both functions will be same. So the domain of g(x) is [-1, 1]
(b) To find the range of g, let us find the range of f(x) using the domain [-1, 1].
f(x) = x2
If x = -1, then y = 1
If x = 0, then y = 0
If x =-1, then y = 1
Range of f(x) is [0, 1]. The range of g(x) can be obtained by multiply -1 with the range of f(x). Hence the range of g(x) is [-1, 0].
(c) Sketching the graph :

Question 2 :
Define a function h by h(x) = f(−x),
where f is the function defined by f(x) = x2, with the domain of f the interval [1/2 , 1].
(a) Find the domain of h.
(b) Find the range of h.
(c) Sketch the graph of h.
Solution :
From the given question h(x) = f(-x), we come to know that, we have to perform reflection of y axis.
(a) According to the definition,to get the domain of the function g(x), we have to multiply the domain of f(x) by the coefficient of 1, that is -1.
So the domain of g(x) is [-1, -1/2]
(b) Because h(x) equals f(−x), we see that the values taken on by h are the same as the values taken on by f . Thus the range of h equals the range of f , which is the interval [ 1/4 , 1].
(c) Sketching the graph :

Kindly mail your feedback to v4formath@gmail.com
We always appreciate your feedback.
©All rights reserved. onlinemath4all.com
Recent Articles
-
Digital SAT Math Problems and Solutions (Part - 146)
Apr 18, 25 06:52 AM
Digital SAT Math Problems and Solutions (Part - 146) -
Logarithmic Derivative Problems and Solutions
Apr 16, 25 09:25 PM
Logarithmic Derivative Problems and Solutions -
Digital SAT Math Problems and Solutions (Part - 145)
Apr 16, 25 12:35 PM
Digital SAT Math Problems and Solutions (Part - 145)

