REPRESENTATION OF FUNCTIONS
A function may be represented by
(i) a set of ordered pairs
(ii) a table form
(iii) an arrow diagram
(iv) a graphical form
Let f : A --> B be a function.
(i) Set of ordered pairs :
The set f = {(x, y) | y ∈ f(x), x ∈ A} of all ordered pairs represent a function.
(ii) Table form :
The values of x and the values of their respective images under f can be given in the form of a table.
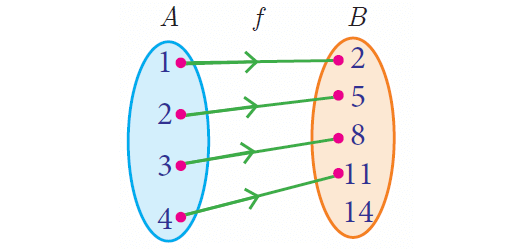
(iii) Arrow diagram :
An arrow diagram indicates the elements of the domain of f and their respective images by means of arrows.
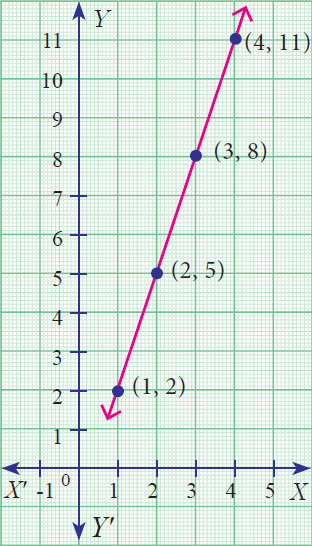
(iv) A graph :
The ordered pairs in the collection
f = {(x,y) | y = f (x), x ∈ A}
are plotted as points in the xy- plane. The graph of f is the totality of all such points.
Every function can be represented by a curve in a graph. But not every curve drawn in a graph will represent a function.
Vertical line test will help us in determining whether a given curve is a function or not.
Vertical line test :
A curve drawn in a graph represents a function, if every vertical line intersects the curve in at most one point.
Example :
Let A = {1, 2, 3, 4} and B = {2, 5, 8, 11, 14} be two sets.
Let f : A --> B be a function given by f(x) = 3x - 1. Represent this function
(i) by arrow diagram
(ii) in a table form
(iii) as a set of ordered pairs
(iv) in a graphical form
Solution :
A = {1, 2, 3, 4} and B = {2, 5, 8, 11, 14}
f(x) = 3x - 1
f(1) = 3(1) – 1 = 3 – 1 = 2
f(2) = 3(2) – 1 = 6 – 1 = 5
f(3) = 3(3) – 1 = 9 – 1 = 8
f(4) = 4(3) – 1 = 12 – 1 = 11
(i) Arrow diagram :

(ii) Table form :
The given function f can be represented in a tabular form as given below.

(iii) Set of ordered pairs :
The function f can be represented as a set of ordered pairs as
f = {(1, 2), (2, 5), (3, 8), (4, 11)}
(iv) Graphical form :
We can plot the following points in the xy -plane to get the graphical form.
(1, 2), (2, 5), (3, 8), (4, 11)

Kindly mail your feedback to v4formath@gmail.com
We always appreciate your feedback.
©All rights reserved. onlinemath4all.com
Recent Articles
-
AP Calculus AB Problems with Solutions (Part - 8)
Jan 30, 25 09:48 AM
AP Calculus AB Problems with Solutions (Part - 8) -
SAT Math Resources (Videos, Concepts, Worksheets and More)
Jan 29, 25 06:00 AM
SAT Math Resources (Videos, Concepts, Worksheets and More) -
Digital SAT Math Problems and Solutions (Part - 105)
Jan 29, 25 05:52 AM
Digital SAT Math Problems and Solutions (Part - 105)
