SKETCH A GRAPH FROM A VERBAL DESCRIPTION
Use the information below to sketch a graph of the polynomial function y = f(x).
* f(x) is positive on the intervals (-2, -1) and (1, 2).
* f(x) is negative on the intervals (-∞, -2), (-1, 1) and (2, ∞).
* f(x) is increasing on the intervals (-∞, -1.5) and (0, 1.5).
* f(x) is decreasing on the intervals (-1.5, 0) and (1.5, ∞)
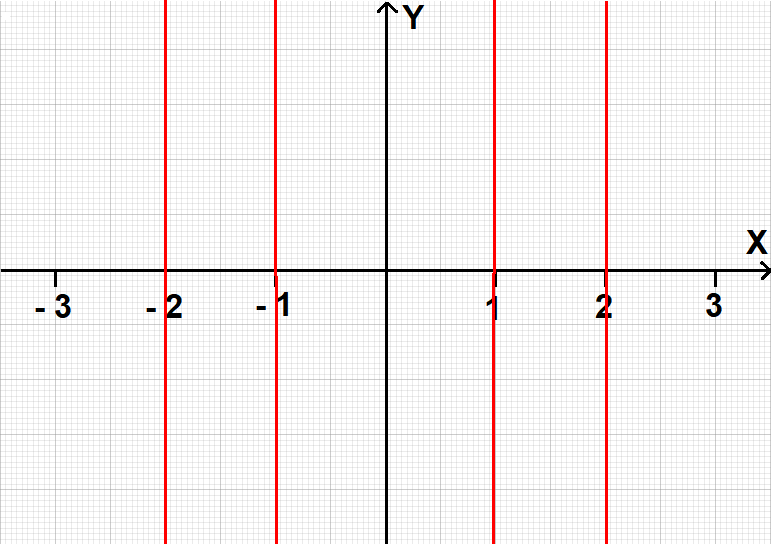
Step 1 :
Using the x-values in positive and negative intervals, we can draw vertical lines parallel to y-axis as shown below.
Step 2 :
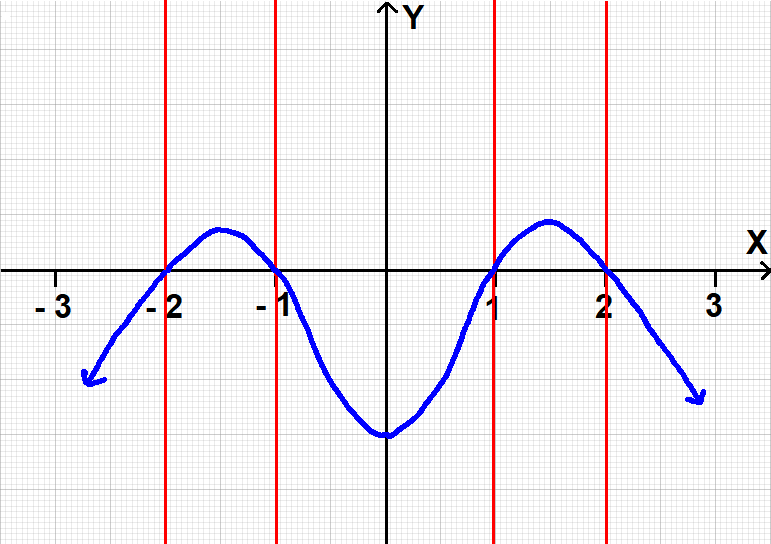
The x-intercepts of the graph are
(-2, 0), (-1, 0), (1, 0) and (2, 0)
That is, the graph has to intersect x-axis at the above points.
Step 3 :
f(x) is positive on the intervals (-2, -1) and (1, 2).
So, the graph should be above the x-axis on the intervals
(-2, -1) and (1, 2).
Step 4 :
f(x) is negative on the intervals (-∞, -2), (-1, 1) and (2, ∞).
So, the graph should be below the x-axis on the intervals
(-∞, -2), (-1, 1) and (2, ∞)
Step 5 :
f(x) is increasing on the intervals (-∞, -1.5) and (0, 1.5).
When we look at the graph from left to right, the graph should be upward on the intervals
(-∞, -1.5) and (0, 1.5)
Step 6 :
f(x) is decreasing on the intervals (-1.5, 0) and (1.5, ∞)
When we look at the graph from left to right, the graph should be downward on the intervals
(-1.5, 0) and (1.5, ∞)
Try Yourself :
Use the information below to sketch a graph of the polynomial function y = f(x).
* f(x) is positive on the intervals (-4, -2) and (2, 4).
* f(x) is negative on the intervals (-∞, -4), (-2, 2) and (4, ∞).
* f(x) is increasing on the intervals (-∞, -3) and (0, 3).
* f(x) is decreasing on the intervals (-3, 0) and (3, ∞).
Kindly mail your feedback to v4formath@gmail.com
We always appreciate your feedback.
©All rights reserved. onlinemath4all.com
Recent Articles
-
Digital SAT Math Problems and Solutions (Part - 131)
Mar 28, 25 05:54 AM
 Digital SAT Math Problems and Solutions (Part - 131)
 -
Digital SAT Math Problems and Solutions (Part - 132)
Mar 28, 25 05:48 AM
Digital SAT Math Problems and Solutions (Part - 132) -
SAT Math Resources (Videos, Concepts, Worksheets and More)
Mar 28, 25 05:46 AM
SAT Math Resources (Videos, Concepts, Worksheets and More)