STEM AND LEAF PLOT
Stem and leaf plot is a special table where each observation of the given data value will be split into a "stem" (the first digit or digits) and a "leaf" (usually the last digit).
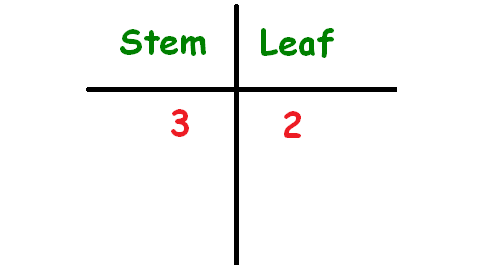
Example :
32 is split in to 3 as "stem and 2 as "leaf".
The picture shown below illustrates this.
Steps to Construct Stem and Leaf Plot
To construct stem and leaf-plot for the given data set, we have to do the following steps.
Step 1 :
Write the observations of the given data set in ascending order.
Step 2 :
Split the observations in to stem and leaf as explained in the example above.
Step 3 :
After having split the observations in to stem and leaf , we have to construct the table as given above.
Examples
Example 1 :
Construct box and stem and leaf-plot the data given below.
4.3, 5.1, 3.9, 4.5, 4.4, 4.9, 5.0, 4.7, 4.1, 4.6, 4.4, 4.3, 4.8, 4.4, 4.2, 4.5, 4.4
Construction of stem and leaf-plot :
Step 1 :
Let us write the observations in the data in ascending order.
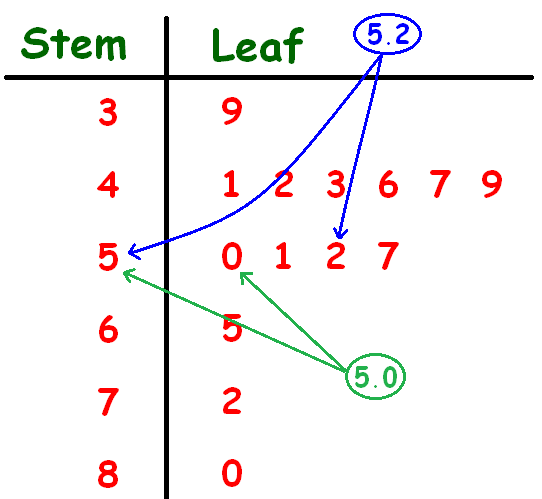
3.9, 4.1, 4.2, 4.3, 4.6, 4.7, 4.9, 5.0, 5.1, 5.2, 5.7, 6.5, 7.2, 8.0
Step 2 :
In each observation, we have two digits. One comes before the decimal and the other one comes after the decimal.
We can consider the digit which comes before the decimal as "stem" and the digit which comes after the decimal as "leaf".
For example, in 3.9, "3" is stem and "9" is leaf.
Step 3 :
Using the idea explained in step 2, let us construct stem and leaf-plot for the given data set.
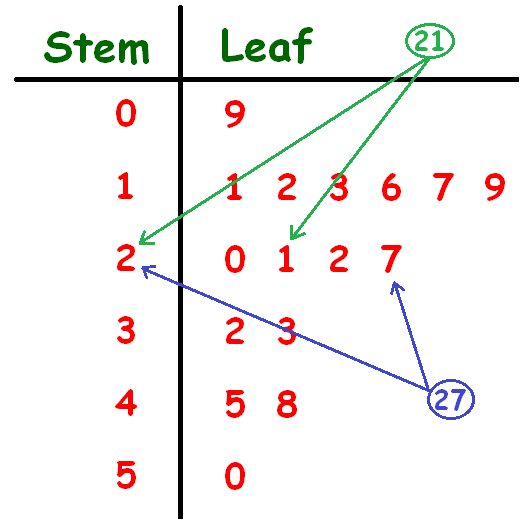
Example 2 :
Construct box and stem and leaf-plot the data given below.
50, 48, 45, 33, 27, 32, 22, 21, 20, 19, 16, 17, 13, 12, 9, 11
Construction of stem and leaf-plot :
Step 1 :
Let us write the observations in the data in ascending order.
9, 11, 12, 13, 16, 17, 19, 20, 21, 22, 27, 32, 33, 45, 48, 50
Step 2 :
In each observation, we have two digits. One is at ten's place and other one is at unit's place.
We can consider the digit at ten's place as "stem" and the digit at unit's place as "leaf".
For example, in 48, "4" is stem and "8" is leaf.
In the given data, all the observations are two digit numbers except the observation "9".
So, we have to write "9" as "09".
In "09" the digit at ten's place is "0" and unit's place is "9"
That is, "0" is stem and "9" is leaf.
Step 3 :
Using the idea explained in step 2, let us construct stem and leaf-plot for the given data set.
Kindly mail your feedback to v4formath@gmail.com
We always appreciate your feedback.
©All rights reserved. onlinemath4all.com
Recent Articles
-
Digital SAT Math Problems and Solutions (Part - 146)
Apr 18, 25 06:52 AM
 Digital SAT Math Problems and Solutions (Part - 146)
 -
Logarithmic Derivative Problems and Solutions
Apr 16, 25 09:25 PM
Logarithmic Derivative Problems and Solutions -
Digital SAT Math Problems and Solutions (Part - 145)
Apr 16, 25 12:35 PM
 Digital SAT Math Problems and Solutions (Part - 145)