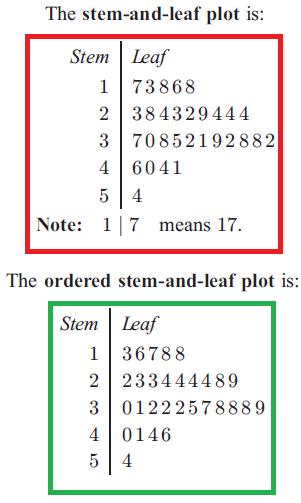
STEM AND LEAF PLOTS
A stem and leaf plot (often called as stem plot) is a way of writing down the data in groups is used for small data sets.
It shows actual data values and given visual comparison of frequencies.
For numbers with two digits,
the first digit forms part of the stem and
the second digit forms part of the leaf.
For example, for the data value 17, 1 is recorded on the stem, and the 7 is a leaf value.
Make the stem and leaf plots for the given data :
Example 1 :
26, 37, 48, 33, 49, 26, 19, 26, 48
Solution :
Arrange the given data set in ascending order.
19, 26, 26, 26, 33, 37, 48, 48, 49
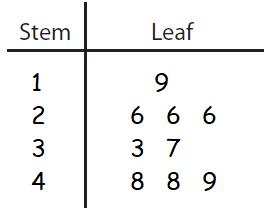
Example 2 :
67, 42, 58, 41, 54, 65, 65, 54, 69, 53
Solution :
Writing the given data values in ascending order, we get
41, 42, 53, 54, 54, 58, 65, 65, 67, 69
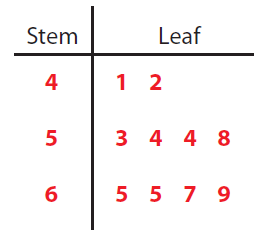
Example 3 :
For the ordered stem-and-leaf plot given, find:
(a) the minimum value
(b) the maximum value
Solution :
The first entry can be considered as minimum value
stem = 0, leaf = 1
Minimum value = 1
The last entry can be considered as maximum value.
stem = 4, leaf = 3
Minimum value = 43.
Example 4 :
A test score out of 60 marks is recorded for a group of 45 students :
34 37 44 51 53 39 33 58 40 42
43 43 47 37 35 41 43 48 50 55
44 44 52 54 59 39 31 29 44 57
45 34 29 27 18 49 41 42 37 42
43 43 45 34 51
a) Construct a stem-and-leaf plot for this data using 0, 1, 2, 3, 4, and 5 as the stems.
b) What advantage does a stem-and-leaf plot have over a frequency table?
c) What is the
i) highest ii) lowest mark scored for the test?
d) If an ‘A’ is awarded to students who scored 50 or more for the test, what percentage of students scored an ‘A’?
e) What percentage of students scored less than half marks for the test?
f) Describe the distribution of the data.
Solution :
(a)
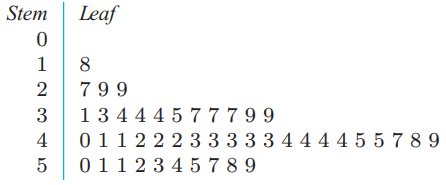
(b) The stem-and-leaf plot shows all the actual data values.
(c) i) Highest mark is 59
ii) Lowest mark = 18
(d) Total number of marks = 45
Number of students who scores 50 or more than 50 = 10
Percentage = (10/45) x 100%
= 22.2 %
Percentage of students who scored more than 50 percentage of marks is 22.2%
(e) Number of students who scored less than half mark
= 4
Percentage = (4/45) x 100%
= 8.88%
e) Negatively skewed with no outliers
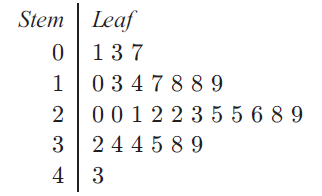
Example 5 :
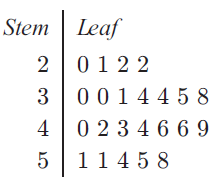
For the data set given, find:
a) the minimum value
b) the maximum value
c) the median
d) the range
Solution :
(a) The first entry is minimum value
stem = 2, leaf = 0
Minimum value = 20
(b) The last entry is maximum value
stem = 5, leaf = 8
Maximum value = 58
c) Total number of values = 23
23 is odd, so median = (23+1)/2
= 24/2
Median = 12th value
So, median is 40.
(d) Range = maximum value - minimum value
= 58-20
= 38

Apart from the stuff given above, if you need any other stuff in math, please use our google custom search here.
Kindly mail your feedback to v4formath@gmail.com
We always appreciate your feedback.
©All rights reserved. onlinemath4all.com
Recent Articles
-
Solving Equations with the Given Roots
Jan 23, 25 04:57 AM
Solving Equations with the Given Roots -
Given Composite Function : How to Find the Inside or Outside Function
Jan 22, 25 02:43 AM
How to Find the Inside or Outside Function From the Given Composite Function -
SAT Math Resources (Videos, Concepts, Worksheets and More)
Jan 20, 25 09:31 PM
SAT Math Resources (Videos, Concepts, Worksheets and More)