TREND LINES AND PREDICTIONS WORKSHEET
Problem 1 :
Lily is getting trained for a 10K race. For some of her training runs, she records the distance she ran and how many minutes she ran.
Distance (miles)
4
2
1
2
3
5
2
4
3
Time (minutes)
38
25
07
16
26
55
20
45
31
Draw a trend line that shows the relationship between distance and time and use it to predict how long it would take for Lily to run 4.5 miles.
Problem 2 :
The scatter plot and trend line show the relationship between the number of chapters and the total number of pages for several books. Use the trend line to predict the number of pages for 18 chapters.

Problem 3 :
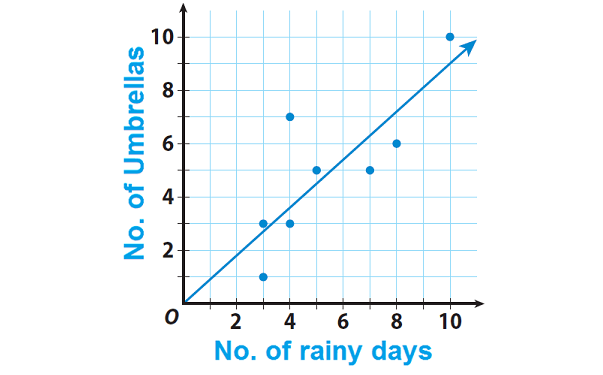
The scatter plot and trend line show the relationship between the number of rainy days in a month and the number of umbrellas sold each month. Use the trend line to predict the number of Umbrellas sold in a month, if there were 10 rainy days.

Detailed Answer Key
Problem 1 :
Lily is getting trained for a 10K race. For some of her training runs, she records the distance she ran and how many minutes she ran.
Distance (miles)
4
2
1
2
3
5
2
4
3
Time (minutes)
38
25
07
16
26
55
20
45
31
Draw a trend line that shows the relationship between distance and time and use it to predict how long it would take for Lily to run 4.5 miles.
Solution :
Step 1 :
Make a scatter plot of Lily’s running data.
To draw a trend line, use a straight edge to draw a line that has about the same number of points above and below it. Ignore any outliers.

Step 2 :
Use the above trend line to predict how long it would take for Lily to run 4.5 miles.
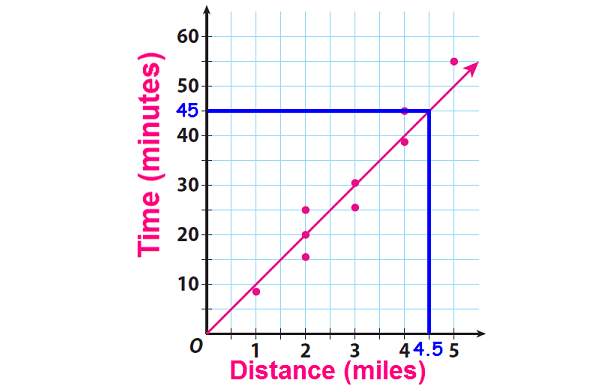
Time taken for Lily to run 4.5 miles is about 45 minutes.
Problem 2 :
The scatter plot and trend line show the relationship between the number of chapters and the total number of pages for several books. Use the trend line to predict the number of pages for 18 chapters.
Solution :
Draw the vertical line from 18 on the horizontal axis to the trend line. Then, draw horizontal line to the vertical axis from the trend line as shown below.
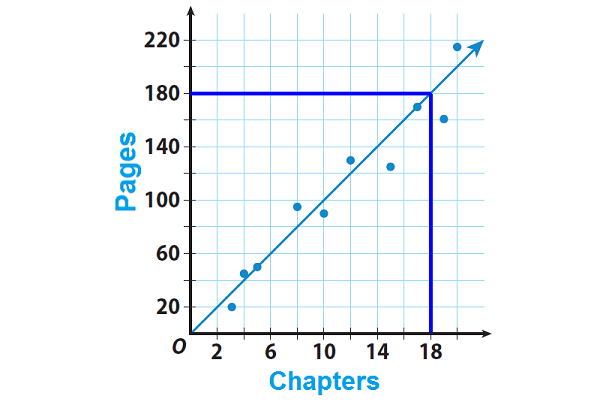
Total number of pages for 18 chapters is about 180.
Problem 3 :
The scatter plot and trend line show the relationship between the number of rainy days in a month and the number of umbrellas sold each month. Use the trend line to predict the number of Umbrellas sold in a month, if there were 10 rainy days.
Solution :
Draw the vertical line from 10 on the horizontal axis to the trend line. Then, draw horizontal line to the vertical axis from the trend line as shown below.
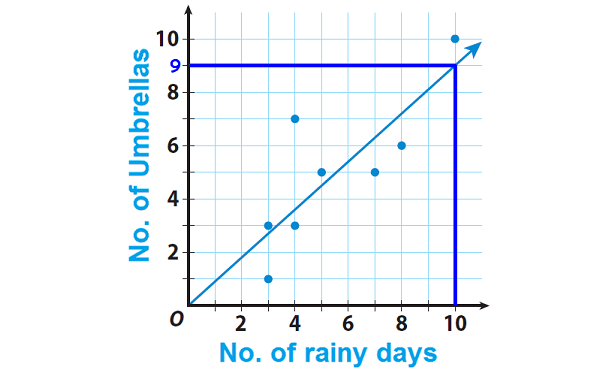
Total number of Umbrellas sold in the month is about 9, if there were 10 rainy days.
Kindly mail your feedback to v4formath@gmail.com
We always appreciate your feedback.
©All rights reserved. onlinemath4all.com
Recent Articles
-
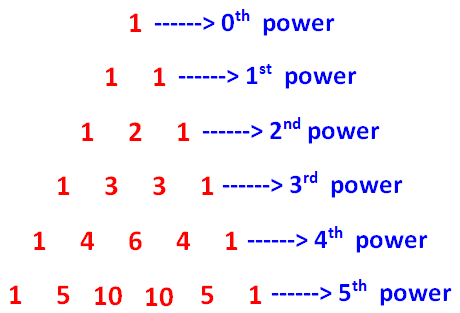
Pascal Triangle and Binomial Expansion
Feb 01, 25 10:12 AM
 Pascal Triangle and Binomial Expansion - Concept - Examples
 -
SAT Math Resources (Videos, Concepts, Worksheets and More)
Feb 01, 25 06:26 AM
SAT Math Resources (Videos, Concepts, Worksheets and More) -
Digital SAT Math Problems and Solutions (Part - 106)
Feb 01, 25 06:23 AM
 Digital SAT Math Problems and Solutions (Part - 106)