USING STATISTICAL MEASURES TO COMPARE POPULATIONS
We can use the statistical measures like mean, median and MAD (mean absolute deviation) to compare populations from the respective samples.
Example :
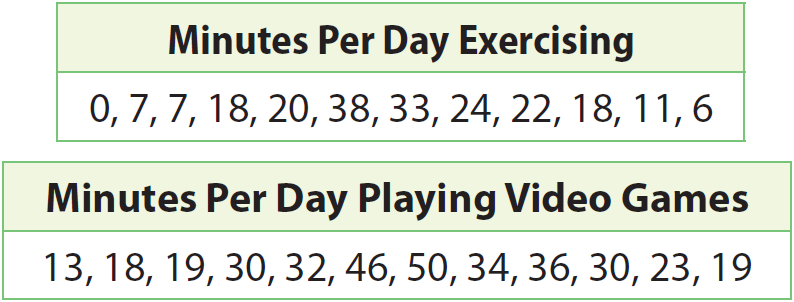
The tables show the number of minutes per day students in a class spend exercising and playing video games. What is the difference of the means as a multiple of the mean absolute deviations ?
Solution :
Step 1 :
Calculate the mean number of minutes per day exercising.
0 + 7 + 7 + 18 + 20 + 38 + 33 + 24 + 22 + 18 + 11 + 6 = 204
Divide the sum by the number of students.
204 ÷ 12 = 17
Step 2 :
Calculate the mean absolute deviation for the number of minutes exercising.
|
|0-17| = 17 |7-17| = 10 |7-17| = 10 |18-17| = 1 |20-17| = 3 |38-17| = 21 |
|33-17| = 16 |24-17| = 7 |22-17| = 5 |18-17| = 1 |11-17| = 6 |6-17| = 11 |
Find the mean of the absolute values.
17 + 10 + 10 + 1 + 3 + 21+ 16 + 7 + 5 + 1 + 6 + 11 = 108
Divide the sum by the number of students.
108 ÷ 12 = 9
Step 3 :
Calculate the mean number of minutes per day playing video games. Round to the nearest tenth.
13+18+19+30+32+46+50+34+36+30+23+19 = 350
Divide the sum by the number of students.
350 ÷ 12 ≈ 29.2
Step 4 :
Calculate the mean absolute deviation for the numbers of minutes playing video games.
|
|13-29.2| = 16.2 |18-29.2| = 11.2 |19-29.2| = 10.2 |30-29.2| = 0.8 |32-29.2| = 2.8 |46-29.2| = 16.8 |
|50-29.2| = 20.8 |34-29.2| = 4.8 |36-29.2| = 6.8 |30-29.2| = 0.8 |23-29.2| = 6.2 |19-29.2| = 10.2 |
Find the mean of the absolute values. Round to the nearest tenth.
16.2 + 11.2 + 10.2 + 0.8 + 2.8 + 16.8 + 20.8 + 4.8 + 6.8 + 0.8 + 6.2 + 10.2 = 107.6
Divide the sum by the number of students.
107.6 ÷ 12 ≈ 9
Step 5 :
Find the difference in the means.
Subtract the lesser mean from the greater mean.
29.2 - 17 = 12.2
Step 6 :
Write the difference of the means as a multiple of the mean absolute deviations, which are similar but not identical.
Divide the difference of the means by the MAD.
12.2 ÷ 9 ≈ 1.36
The means of the two data sets differ by about 1.4 times the variability of the two data sets.
Using Multiple Samples to Compare Populations
A group of about 250 students in grade 7 and about 250 students in grade 11 were asked, “How many hours per month do you volunteer?” Responses from one random sample of 10 students in grade 7 and one random sample of 10 students in grade 11 are summarized in the box plots.
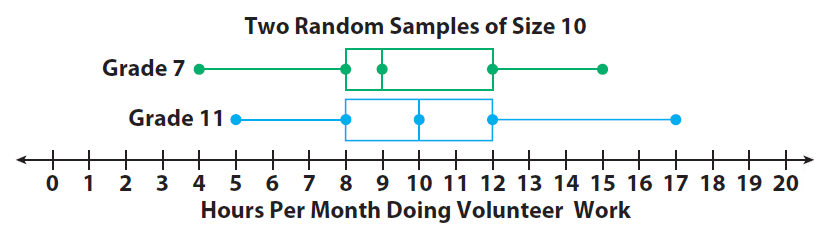
How can we tell if the grade 11 students do more volunteer work than the grade 7 students ?
Step 1 :
The median is higher for the students in grade 11. But there is a great deal of variation. To make an inference for the entire population, it is helpful to consider how the medians vary among multiple samples.
Step 2 :
The box plots below show how the medians from 10 different random samples for each group vary.
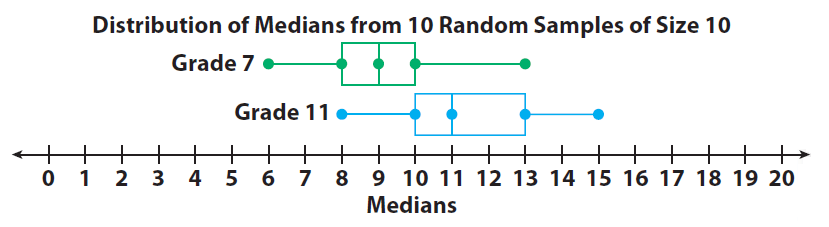
The medians vary less than the actual data. Half of the grade 7 medians are within 1 hour of 9. Half of the grade 11 medians are within 1 or 2 hours of 11.
Although the distributions overlap, the middle halves of the data barely overlap.
This is fairly convincing evidence that the grade 11 students volunteer more than the grade 7 students.
Kindly mail your feedback to v4formath@gmail.com
We always appreciate your feedback.
©All rights reserved. onlinemath4all.com
Recent Articles
-
Digital SAT Math Problems and Solutions (Part - 150)
Apr 25, 25 11:46 AM
Digital SAT Math Problems and Solutions (Part - 150) -
AP Calculus AB Problems with Solutions (Part - 19)
Apr 24, 25 11:10 PM
AP Calculus AB Problems with Solutions (Part - 19) -
AP Calculus AB Problems with Solutions (Part - 18)
Apr 24, 25 11:06 PM
 AP Calculus AB Problems with Solutions (Part - 18)