WRITE THE FORMULA CONNECTING TWO VARIABLES X AND Y GIVEN IN THE TABLE
For each of the following tables, write a formula connecting the variables.
Check your formula for all the number pairs given :
Example 1 :

Solution :
Let the linear relationship between x and y is
y = Ax + B
(where x is input and y is output)
Here, input (x) = a
Output (y) = N
By writing the given values as ordered pairs, we get
(1, 4) (2, 6) (3, 8)(4, 10) (5, 12) (6, 14)
|
Applying (1, 4) 4 = A(1) + B A + B = 4 -----(1) |
Applying (2, 6) 6 = A(2) + B 2A + B = 6 -----(2) |
(1) – (2)
A + B – 2A – B = 4 – 6
- A = - 2
A = 2
By applying A = 2 in equation (1), we get
2 + B = 4
B = 2
so, A = 2 and B = 2
By applying A = 2 and B = 2 in linear equation
N = 2a + 2
Therefore, the formula is N = 2a + 2
Example 2 :

Solution :
(1, 4) (2, 5) (3, 6) (4, 7) (5, 8) (6, 9)
|
Applying (1, 4) 4 = A(1) + B A + B = 4 -----(1) |
Applying (2, 5) 5 = A(2) + B 2A + B = 5 -----(2) |
(1) –
(2)
A + B – 2A – B = 4 – 5
A
= 1
By applying A = 1 in equation (1), we get
B
= 3
so, A = 1 and B = 3
By applying A = 1 and B = 3 in linear equation,
y = x + 3
Therefore, the formula is y = x + 3
Example 3 :

Solution :
y
= Ax + B
7 = A(1) + B
A + B = 7 -----(1)
If 2nd pair (2, 11)
y = Ax + B
11 = A(2) + B
2A + B = 11 -----(2)
Subtract (1) – (2), we get
A + B – 2A – B = 7 – 11
A
= 4
By applying A = 4 in equation (1), we get
4 + B = 7
B = 3
so, A = 4 and B = 3
By applying A = 4 and B = 3 in linear equation,
K
= 4c + 3
Therefore, the formula is K = 4c + 3
Example 4 :

Solution :
(1, 4) (2, 11) (3, 18) (4, 25) (5, 32) (6, 39)
|
Applying (1, 4) 4 = A(1) + B A + B = 4 -----(1) |
Applying (2, 11) 11 = A(2) + B 2A + B = 11 -----(2) |
(1) –
(2)
A + B – 2A – B = 4 – 11
A = 7
By applying A = 7 in equation (1), we get
7 + B
= 4
B = - 3
so, A = 7 and B = -3
By applying A = 7 and B = -3 in linear equation,
Q
= 7d - 3
Therefore, the formula is Q = 7d - 3
Example 5 :

Solution :
(1, 8) (2, 14) (3, 20) (4, 26) (5, 32) (6, 38)
|
Applying (1, 8) 8 = A(1) + B A + B = 8 -----(1) |
Applying (2, 14) 14 = A(2) + B 2A + B = 14 -----(2) |
(1) –
(2)
A + B – 2A – B = 8 – 14
A
= 6
By applying A = 6 in equation (1), we get
6 + B
= 8
B = 2
so, A = 6 and B = 2
By applying A = 6 and B = 2 in linear equation,
C
= 6h + 2
Therefore, the formula is C = 6h + 2
Example 6 :

Solution :
|
6 = A(1) + B A + B = 6 -----(1) |
14 = A(2) + B 2A + B = 14 -----(2) |
(1) –
(2)
A + B – 2A – B = 6 – 14
A = 8
By applying A = 8 in equation (1), we get
8 + B
= 6
B = -2
so, A = 8 and B = -2
By applying A = 8 and B = -2 in linear equation,
M = 8n - 2
Therefore, the formula is M = 8n - 2
Example 7 :
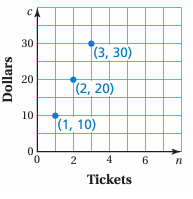
The graph represents the cost c (in dollars) of buying n tickets to a baseball game.
a. Should the points be connected with a line to show all the solutions? Explain your reasoning.
b. Write an equation in two variables that represents the graph.
Solution :
The points lie on the graph are (1, 10) (2, 20) and (3, 30)
a) The slopes will be equal for the collinear points.
Slope of the line joining the points (1, 10) and (2, 20)
m = (y2 - y1)/(x2 - x1)
= (20 - 10) / (2 - 1)
= 10/1
= 10
Slope of the line joining the points (2, 20) and (3, 30)
m = (y2 - y1)/(x2 - x1)
= (30 - 20) / (3 - 2)
= 10/1
= 10
So, the points are collinear that it it creates a line
b) Equation of the line :
y - y1 = m(x - x1)
y - 20 = 10(x - 2)
y - 20 = 10x - 20
10x - y - 20 + 20 = 0
10x - y = 0
Example 8 :
You earn $8 per hour working part-time at a store. a. Complete the table.
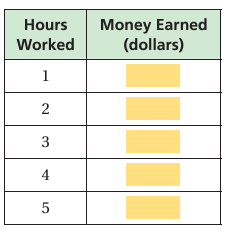
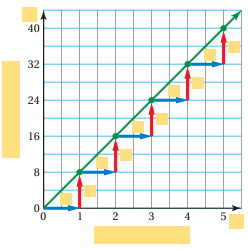
Use the values from the table to complete the graph. Then answer each question below.
a) What does the horizontal axis represent? What variable did you use to identify it?
b) What does the vertical axis represent? What variable did you use to identify it?
c) How are the ordered pairs in the graph related to the values in the table?
d) How are the horizontal and vertical distances shown on the graph related to the values in the table?
e) How can you write an equation that shows how the two variables are related?
f) What does the green line in the graph represent?
Solution :
Earning per hour = $8
Let x be the total number of hours. Let y be the total cost.
y = 8x
When x = 1, y = 8(1) ==> 8
When x = 2, y = 8(2) ==> 16
When x = 3, y = 8(3) ==> 24
When x = 4, y = 8(4) ==> 32
When x = 5, y = 8(5) ==> 40
|
x 1 2 3 4 5 |
y 8 16 24 32 40 |
a) The horizontal axis represents number of hours. It is mentioned with variable x.
b) The vertical represents axis total amount. It is mentioned with the variable y.
c) The ordered pairs are (1, 8) (2, 16) (3, 24) (4, 32) and (5, 40). The ordered pair shows (number of hours, total cost).
d)
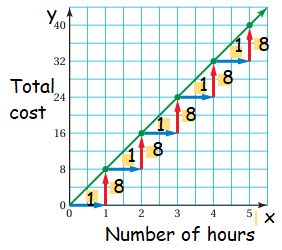
e) Slope of the line = 8/1 ==> 8
y-intercept = 0
f) Equation of the line
y = mx + b
y = 8x + 0
y = 8x
Kindly mail your feedback to v4formath@gmail.com
We always appreciate your feedback.
©All rights reserved. onlinemath4all.com
Recent Articles
-
SAT Math Resources (Videos, Concepts, Worksheets and More)
Jan 10, 25 05:08 AM
SAT Math Resources (Videos, Concepts, Worksheets and More) -
Digital SAT Math Problems and Solutions (Part - 98)
Jan 10, 25 05:02 AM
Digital SAT Math Problems and Solutions (Part - 98) -
PRECALCULUS : Domain and Range of Composite Functions
Jan 09, 25 01:09 PM
PRECALCULUS : Domain and Range of Composite Functions
