ANALYZING HISTOGRAM WORKSHEET
Subscribe to our ▶️ YouTube channel 🔴 for the latest videos, updates, and tips.
Question 1 :
A birdwatcher counts and records the number of birds at a bird feeder every morning at 9:00 for several days.
12, 3, 8, 1, 1, 6, 10, 14, 3, 6, 2, 1, 3, 2, 7
(i) Make a histogram for the above data.
(ii) Analyze the histogram
Question 2 :
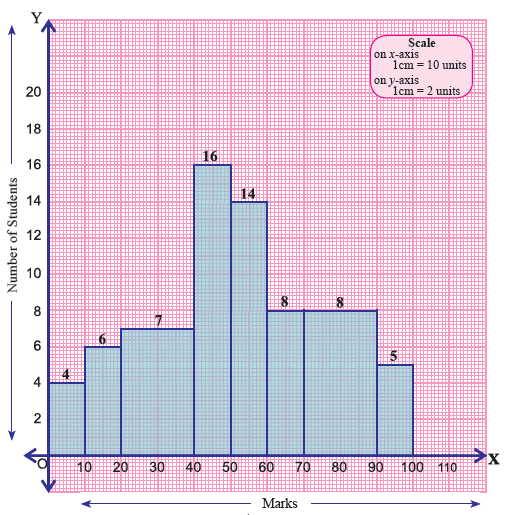
Look at the data given in the histogram and answer the questions.

(i) How many students have scored marks from 0 to 10 ?
(ii) Find the interval of marks have been scored by maximum number of students.
(iii) How many students have scored marks from 70 to 90 ?
(iv) What is the difference between the number of students in scoring marks from 60 to 70 and 90 to 100 ?
(v) Find the total number of students in the mark interval 40 to 60.
Question 3 :
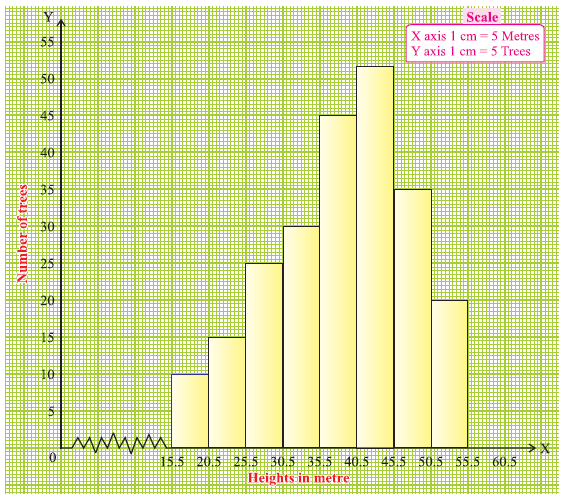
Look at the data given in the histogram and answer the questions.

(i) How many trees do have the height from 15.5 to 20.5 meters ?
(ii) Find the interval of height where the maximum number of trees are there.
(iii) How many trees do have the height from 35.5 to 40.5 meters ?
(iv) What is the difference between the number of trees in the height 20.5 to 25.5 and 45.5 to 50.5 ?
(v) Find the total number of trees in the height interval 45.5 to 55.5 meters.

Detailed Answer Key
Question 1 :
A birdwatcher counts and records the number of birds at a bird feeder every morning at 9:00 for several days.
12, 3, 8, 1, 1, 6, 10, 14, 3, 6, 2, 1, 3, 2, 7
Answer :
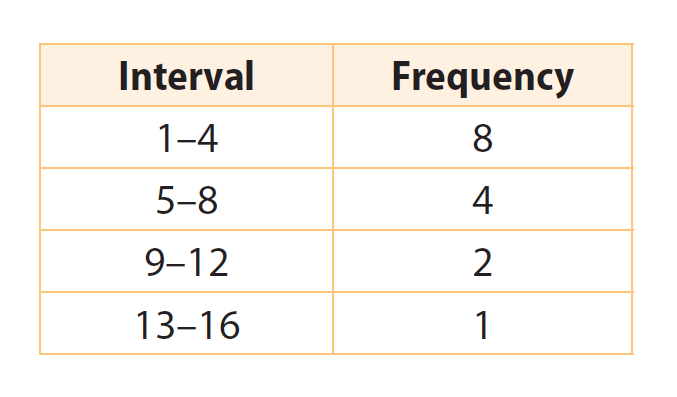
To make histogram, first we have construct a frequency table for the above data

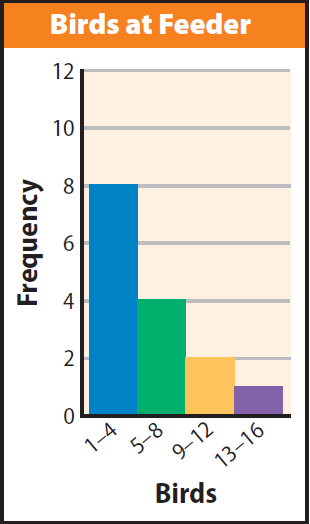
Based on the above frequency table, let us make a histogram for the above data.

Analyzing the Above Histogram :
The highest bar is for the interval 1–4, which means that on more than half the days (8 out of 15), the birdwatcher saw only 1–4 birds.
The bars decrease in height from left to right, showing that it was more likely for the birdwatcher to see a small number of birds rather than a large number on any given day.
Question 2 :
Look at the data given in the histogram and answer the questions.

(i) How many students have scored marks from 0 to 10 ?
(ii) Find the interval of marks have been scored by maximum number of students.
(iii) How many students have scored marks from 70 to 90 ?
(iv) What is the difference between the number of students in scoring marks from 60 to 70 and 90 to 100 ?
(v) Find the total number of students in the mark interval 40 to 60.
Answers :
(i) 4
(ii) 40 to 50
(iii) 8
(iv) 3
(v) 30
Question 3 :
Look at the data given in the histogram and answer the questions.

(i) How many trees do have the height from 15.5 to 20.5 meters ?
(ii) Find the interval of height where the maximum number of trees are there.
(iii) How many trees do have the height from 35.5 to 40.5 meters ?
(iv) What is the difference between the number of trees in the height 20.5 to 25.5 and 45.5 to 50.5 ?
(v) Find the total number of trees in the height interval 45.5 to 55.5 meters.
Answers :
(i) 10
(ii) 40.5 to 45.5
(iii) 45
(iv) 20
(v) 55
Subscribe to our ▶️ YouTube channel 🔴 for the latest videos, updates, and tips.
Kindly mail your feedback to v4formath@gmail.com
We always appreciate your feedback.
About Us | Contact Us | Privacy Policy
©All rights reserved. onlinemath4all.com

Recent Articles
-
Digital SAT Math Problems and Solutions (Part - 1)
Feb 05, 26 09:37 AM
Digital SAT Math Problems and Solutions (Part - 1) -
AP Precalculus Problems and Solutions
Feb 05, 26 06:41 AM
AP Precalculus Problems and Solutions -
SAT Math Preparation with Hard Questions
Feb 05, 26 05:30 AM
SAT Math Preparation with Hard Questions

