BIVARIATE DATA
Subscribe to our ▶️ YouTube channel 🔴 for the latest videos, updates, and tips.
When data are collected on two variables simultaneously, hey are known as bivariate data and the corresponding frequency distribution, derived from it, is known as Bivariate Frequency Distribution.
If x and y denote marks in statistics and math for a group of 30 students, then the corresponding bivariate data would be (x, y).
Here "x" stand for the marks in statistics and "y' stands for the marks in math.
As in the case of a Univariate Distribution, we need to construct the frequency distribution for bivariate data. Such a distribution takes into account the classification in respect of both the variables simultaneously.
Usually, we make horizontal classification in respect of x and vertical classification in respect of the other variable y. Such a distribution is known as Bivariate Frequency Distribution or Joint Frequency Distribution or Two way classification of the two variables x and y.
Example :
Prepare a Bivariate Frequency table for the following data relating to the marks in Statistics (x) and Mathematics (y) :
(15, 13), (1, 3), (2, 6), (8, 3), (15, 10), (3, 9), (13, 19),
(10, 11), (6, 4), (18, 14), (10, 19), (12, 8), (11, 14), (13, 16),
(17, 15), (18, 18), (11, 7), (10, 14), (14, 16), (16, 15), (7, 11),
(5, 1), (11, 15), (9, 4), (10, 15), (13, 12) (14, 17), (10, 11),
(6, 9), (13, 17), (16, 15), (6, 4), (4, 8), (8, 11), (9, 12),
(14, 11), (16, 15), (9, 10), (4, 6), (5, 7), (3, 11), (4, 16),
(5, 8), (6, 9), (7, 12), (15, 6), (18, 11), (18, 19), (17, 16)
(10, 14)
Take mutually exclusive classification for both the variables, the first class interval being 0-4 for both.
Solution :
From the given data, we find that
Range for x = 19–1 = 18
Range for y = 19–1 = 18
We take the class intervals 0-4, 4-8, 8-12, 12-16, 16-20 for both the variables.
Since the first pair of marks is (15, 13) and 15 belongs to the fourth class interval (12-16) for x and 13 belongs to the fourth class interval for y, we put a stroke in the (4, 4)-th cell.
We carry on giving tally marks till the list is exhausted.
Bivariate Frequency Distribution of Marks in Statistics and Mathematics.
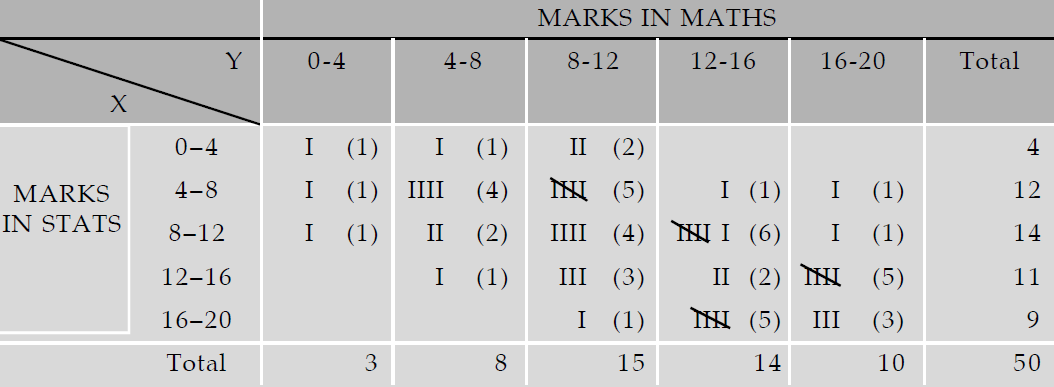
We note, from the above table, that some of the cell frequencies are zero. Starting from the above Bivariate Frequency Distribution, we can obtain two types of univariate distributions which are known as:
(a) Marginal distribution.
(b) Conditional distribution.
If we consider the distribution of Statistics marks along with the marginal totals presented in the last column of the above table, we get the marginal distribution of marks in Statistics. Similarly, we can obtain one more marginal distribution of Mathematics marks.
The following table shows the marginal distribution of marks of Statistics.
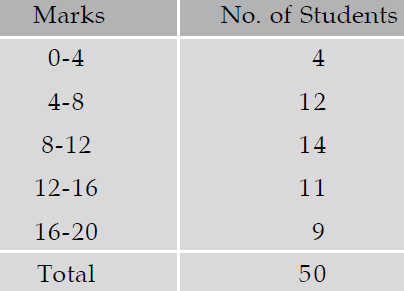
We can find the mean and standard deviation of marks in Statistics from the above table. They would be known as marginal mean and marginal SD of Statistics marks.
Similarly, we can obtain the marginal mean and marginal SD of Mathematics marks. Any other statistical measure in respect of x or y can be computed in a similar manner.
The following table shows that the conditional distribution of marks in Statistics for students having mathematics marks between 8 to 12
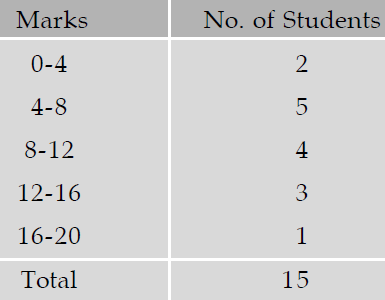
We may obtain the mean and SD from the above table. They would be known as conditional mean and conditional SD of marks of Statistics. The same result holds for marks in Mathematics.
In particular, if there are m classifications for x and n classifications for y, then there would be altogether (m + n) conditional distribution.
Subscribe to our ▶️ YouTube channel 🔴 for the latest videos, updates, and tips.
Kindly mail your feedback to v4formath@gmail.com
We always appreciate your feedback.
About Us | Contact Us | Privacy Policy
©All rights reserved. onlinemath4all.com

Recent Articles
-
Digital SAT Math Problems and Solutions (Part - 50)
Mar 06, 26 07:48 PM
 Digital SAT Math Problems and Solutions (Part - 50)
 -
Digital SAT Math Problems and Solutions (Part - 49)
Mar 06, 26 06:47 PM
 Digital SAT Math Problems and Solutions (Part - 49)
 -
Digital SAT Math Problems and Solutions (Part - 48)
Mar 06, 26 05:24 PM
 Digital SAT Math Problems and Solutions (Part - 48)


