DATA INTERPRETATION WORKSHEET
Problem 1 :
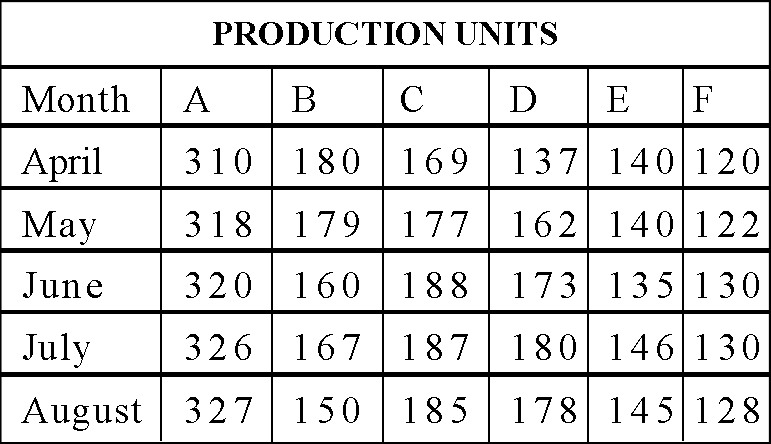
Refer to the following information and answer the questions 1 to 5.
Production of sugar by six major production units in million tonnes.

Question 1 :
In which month the unit B has a contribution of approximately 15% in the total sugar production?
Question 2 :
Which unit shows continuous increase in production of sugar over months?
Question 3 :
In the case of Unit E, in which of the following pairs of months the production of sugar was equal?
Question 4 :
In the month of June, how many units have a share of more than 25% of the total production of sugar?
Question 5 :
What was approximate percentage decrease in sugar production of unit B in June as compared to April?
Problem 2 :
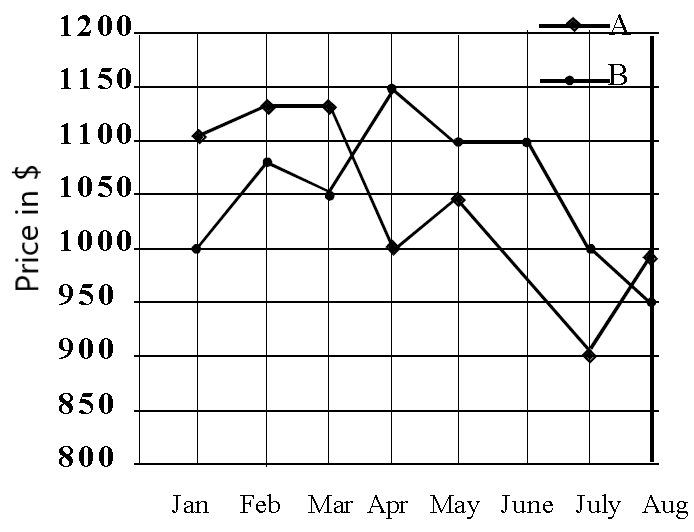
Refer to the following graph and answer the questions 6 to 10.
Production of food grain over the years (1000 tonnes)

Question 6 :
What was the price difference between commodity A and B in the month of April?
Question 7 :
What was the difference in average price between commodity A and B from April to August?
Question 8 :
In which of the two months was the price of commodity A same?
Question 9 :
What was the approximate percentage decrease in the price of commodity A from March to April?
Question 10 :
What was the percentage increase in price of commodity B from January to April?
Problem 3 :
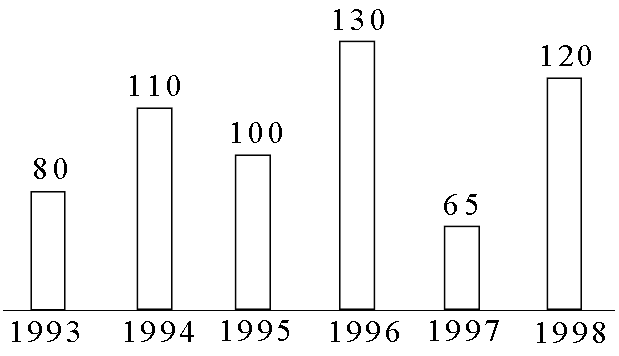
Refer to the following graph and answer the questions 11 to 15.
Production of food grain over the years (1000 tonnes)

Question 11 :
In the case of how many years was the production below the average production of the given years?
Question 12 :
What was the percentage drop in production from 1996 to 1997?
Question 13 :
In which year was the production 50% of the total production in 1993 and 1998 together ?
Question 14 :
If the production in 1999 will be above the average production of the given years, what could be the minimum production for 1999?
Question 15 :
What was the approximate percentage increase in production from 1993 to 1994 ?

Answers
1. Answer :
1. Total production in April :
= 310 + 180 + 169 + 137 + 140 + 120
= 1056
15% of 1056 = 0.15 x 1056
= 158.4
Total Production in June :
= 320 + 160 + 188 + 173 + 135 + 130
= 1106
15% 1106 = 0.15 x 1106
= 165.9
Total production in July :
= 326 + 167 + 187 + 146 + 130 = 1136
15% of 1136 = 0.15 x 1136
= 170.4
Total Production in August :
= 327 + 150 + 185 + 178 + 145 + 128
= 1113
15% of 1113 = 0.15 x 1113
= 166.95
≈ 167
That is, in Month July, the Unit B has a contribution of approximately 15% in the total sugar production.
2. Answer :
Unit A shows continuous increase in production of sugar over months.
3. Answer :
In Unit E, the pair of months that shows equal sugar production is April and May.
4. Answer :
Total Production in June :
= 320 + 160 + 188 + 173 + 135 + 130
= 1106
25% of 1106 = 0.25 x 1106
= 276.5 units
Unit A shows more than 25% of the total production of sugar in the month June.
5. Answer :
In unit B, the production in June is 160 and the production in April is 180 units.
Decrease in percentage :
= 11.11 %
≈ 11%
6. Answer :
The price of commodity A in April is $1000.
The price of commodity B in April is $1150.
Difference :
= 1150 - 1000
= $150
7. Answer :
Average price of commodity A from April to August :
= $985
Average price of commodity B from April to August :
= $1060
Difference :
= 1060 - 985
= $75
8. Answer :
Price of commodity A in April is $1000.
Price of commodity A in August $1000.
Therefore, in April - August the price of commodity A was same.
9. Answer :
Price of commodity A in March is $1125.
Price of commodity A in April is $1000.
Decrease in percentage :
= 11.11 %
≈ 11%
10. Answer :
Price of commodity B in January is $1000.
Price of commodity B in April $1150.
Increase in percentage :
= [(1150 - 1000) / 1000] x 100
= (150/1000) x 100
= 15 %
11. Answer :
Average production :
= 100.833 thousand tonnes
≈ 100900 tonnes
Production in 1993, 1995 and 1997 was below the average.
12. Answer :
Production in 1996 = 130 thousand tonnes
Production in 1997 = 65 thousand tonnes
Decrease in percentage :
= 50%
13. Answer :
Total Production in 1993 and 1998 :
= 80 + 120
= 200
50% of 200 = 0.5 x 200
= 100
The production in 1995 was 50% of the total production in 1993 and 1998.
14. Answer :
Average production = 100900 tonnes
Therefore the minimum production in 1999 will be 100900 tonnes.
15. Answer :
Production in 1993 = 80 thousand tonnes
Production in 1994 = 110 thousand tonnes
Increase in percentage :
≈ 38%
Kindly mail your feedback to v4formath@gmail.com
We always appreciate your feedback.
©All rights reserved. onlinemath4all.com
Recent Articles
-
AP Calculus AB Problems with Solutions (Part - 10)
Feb 06, 25 09:46 AM
AP Calculus AB Problems with Solutions (Part - 10) -
AP Calculus AB Problems with Solutions (Part - 8)
Feb 05, 25 12:22 PM
AP Calculus AB Problems with Solutions (Part - 8) -
AP Calculus AB Problems with Solutions (Part - 9)
Feb 05, 25 12:15 PM
AP Calculus AB Problems with Solutions (Part - 9)
