GRAPHING REAL WORLD SITUATIONS WORKSHEET
1. Jacob learned how to spell the same number of words each day. Sketch a graph for Jacob's learning to spell words.
2. Michael started by learning how to spell the same number of words each day but then learned a greater number of words each day. Sketch a graph for Michael's learning to spell words.
3. George started by learning how to spell many words each day but then learned fewer and fewer words each day. Sketch a graph for George's learning to spell words.
4. A person steadily increases his speed for some time, then he maintains the constant rate. Sketch a graph for the above situation.
5. A person begins his ride slowly but then stops to talk with some friends. After a few minutes, he continues his ride, gradually increasing his speed. Sketch a graph for the above situation.
6. A person steadily increases his speed through most of his ride. Then the person A slows down as he nears some trees. Sketch a graph for the above situation.

1. Answer :
Jacob learned how to spell the same number of words each day.
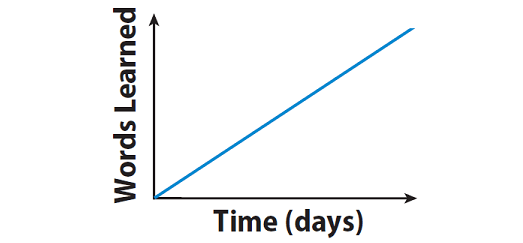
Explanation :
The graph given above shows a constant rate. This means, Jacob learned how to spell the same number of words each day.
2. Answer :
Michael started by learning how to spell the same number of words each day but then learned a greater number of words each day.
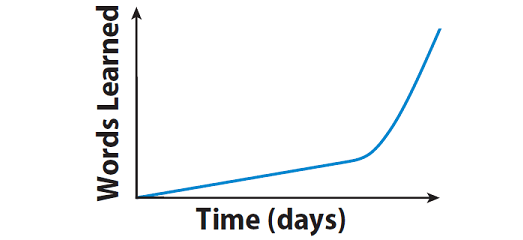
Explanation :
The graph given above begins with a steep curve that gets more shallow. This means, Michael started by learning how to spell the same number of words each day but then learned a greater number of words each day.
3. Answer :
George started by learning how to spell many words each day but then learned fewer and fewer words each day.
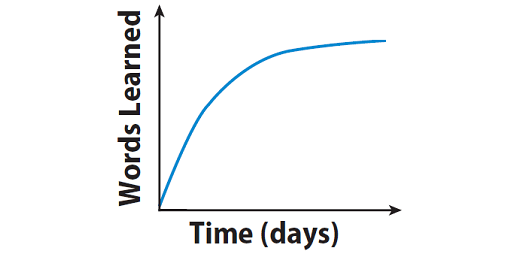
Explanation :
The graph given above begins with a steep curve that gets more shallow. This means, George started by learning how to spell many words each day but then learned fewer and fewer words each day.
4. Answer :
A person steadily increases his speed for some time, then he maintains the constant rate.
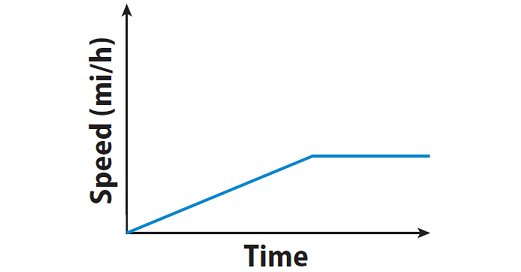
Explanation :
The graph starts with a positive slope and slope becomes zero. This means, the person steadily increases his speed for some time, then he maintains the constant rate.
5. Answer :
A person begins his ride slowly but then stops to talk with some friends. After a few minutes, he continues his ride, gradually increasing his speed.
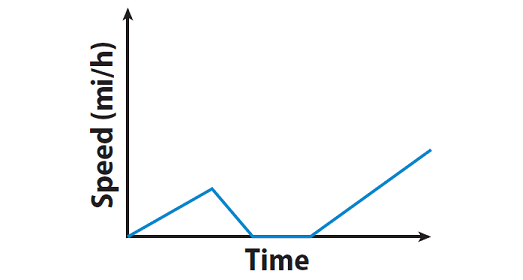
Explanation :
The graph starts with a positive slope, then the slope becomes negative, zero and positive. This means, the person begins his ride slowly but then stops to talk with some friends. After a few minutes, he continues his ride, gradually increasing his speed.
6. Answer :
A person steadily increases his speed through most of his ride. Then the person A slows down as he nears some trees.
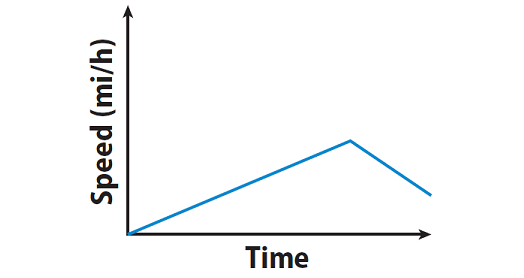
Explanation :
The graph given above starts with a positive slope, then the slope becomes negative. This means, the person steadily increases his speed through most of his ride. Then the person A slows down as he nears some trees.
Kindly mail your feedback to v4formath@gmail.com
We always appreciate your feedback.
©All rights reserved. onlinemath4all.com
Recent Articles
-
AP Calculus AB Problems with Solutions (Part - 10)
Feb 11, 25 11:15 AM
 AP Calculus AB Problems with Solutions (Part - 10)
 -
AP Calculus AB Problems with Solutions (Part - 11)
Feb 11, 25 11:09 AM
 AP Calculus AB Problems with Solutions (Part - 11)
 -
AP Calculus AB Problems with Solutions (Part - 9)
Feb 10, 25 06:02 PM
AP Calculus AB Problems with Solutions (Part - 9)